iDn Digital Headstage Interface

The iD2 and iD3 record from high channel count digital headstages. The iD2 is compatible with Intan-based digital headstages. It has two input connectors that can read up to 128 channels each, for a total of 256 channels. The iD3 has a single connection for a Neuropixels 1.0 probe. All raw data is streamed via USB 3 back to the computer running Synapse and recorded straight to disk. A compressed signal of all digitized channels (up to 256 for iD2, up to 384 for iD3) is returned to Synapse for visualization. Up to 16 selectable channels of the raw data are also available on the DSP for real-time processing and visualization.
-
The iD2 includes impedance testing functionality for each headstage
-
The iD3 includes a refined channel and region selection interface
-
Onboard LEDs provide live feedback of the headstage connection and activity
See the Hardware Manual for information on iD2 technical specifications.
Important
On iPac devices, the iDn can only stream USB data with a custom modification to the iPac4.
Shared iDn Options
All iDn devices read from digital headstages, stream the raw data back to the PC and to disk at full bandwidth using a dedicated USB3 port on the front of the device, and allow you to select up to 16 "focus channels" that can be used for real-time processing at full sampling rate.
USB Streaming
The front panel of the iDn has a separate USB3 connection back to the computer that is running Synapse. This connection streams all channels at full bandwidth straight to disk without going through the processor interface bottleneck.
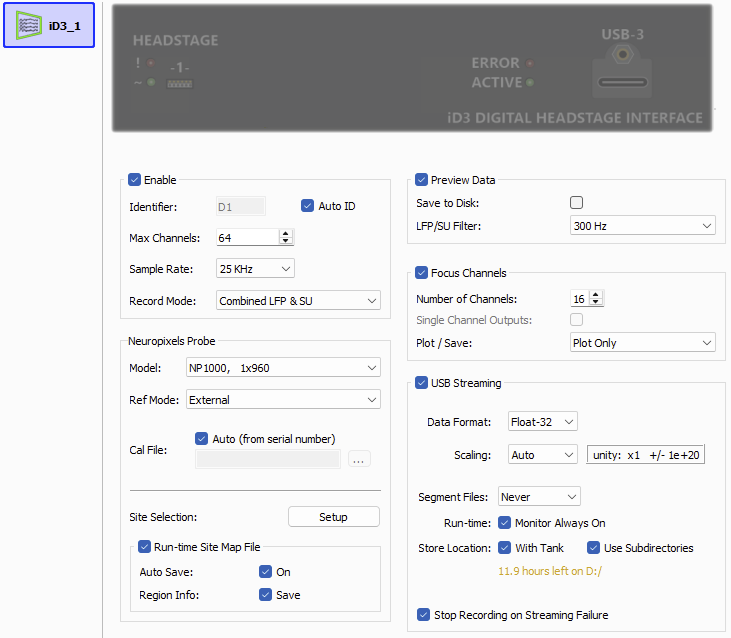
The iDn streams the data at the Sample Rate defined in the iD2 Options or iD3 Options section. You can select the data format and any scaling.
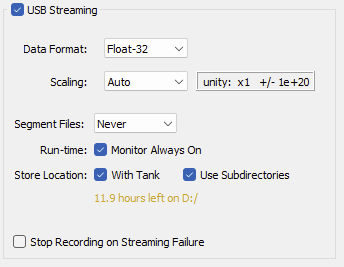
Segment Files Every lets you split up the data files automatically at the specified interval. The new file will begin exactly one sample after the previous file. This is useful for long recordings where the user wants access to the raw data for parallel processing before the recording is over.
Run-time Monitor adds a runtime interface that warns you of data errors and USB connection issues. It shows the internal buffer status, data saved, and space remaining.
Stop Recording on Streaming Failure will end the recording if USB streaming errors are detected. You'll get a 10 second warning before the block stops recording.
By default the data is stored in the same block folder as the rest of the recording. Use the Store Location option to save the iDn data files to a different folder.
Preview Data
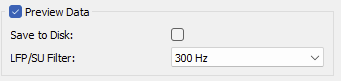
Enable Preview Data to return a highly compressed version of the raw signal to the processor and Synapse for visualization of all headstage channels. This data is plot decimated, which means a short chunk of points is compressed into just the maximum and minimum values of that chunk. The rest of the chunk is thrown away. This is how you can see many seconds of ~25 kHz data on a 2000 pixel wide monitor and still see the main features of it. The actual data rate depends on the System rate and number of channels, but is usually ~300-1500 Hz. This is fine for monitoring the signal for activity and requires very low bandwidth, but is not useful for data analysis and should rarely be saved.
The plot decimated data can optionally be filtered on the iDn itself. If the iDn is running at ~12 kHz or above, you can enable a 100 Hz, 300 Hz, or 500 Hz LFP/SU Filter on the device. At lower sampling rates, there is no filter available.
Focus Channels
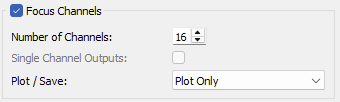
Up to 16 user-selectable Focus Channels are returned to the processor and Synapse at the full data rate for real-time processing and visualization.
Optionally create Single Channel Outputs to link to other gizmos, depending on the number of focus channels you have.
Use the Plot / Save option to visualize and/or store the raw signal from the focus channels at runtime.
Shared iDn Runtime Features

Set the state of the plot decimated filter to lowpass (LFP), highpass (SU), or disabled (Off).
USB Streaming Status
The runtime interface shows the current status of the USB connection. Any errors will turn the LED red and display a message in this box.
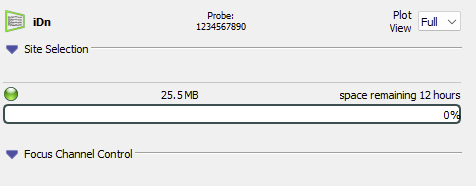
The progress bar indicates how much of the iD2 buffer is full of data that hasn't been transferred yet. This will typically be at 0% during runtime, but may spike at the beginning of the recording when the storage files are being generated, or if there are any data transfer issues to the PC.
The runtime interface also shows how much data has been recorded from the iD2, and an estimate of the recording time available on the hard drive.
If Stop Recording on Streaming Failure is enabled and USB connection is lost, you'll see an error message and a 10 second countdown timer until a message box confirms that the recording will stop.

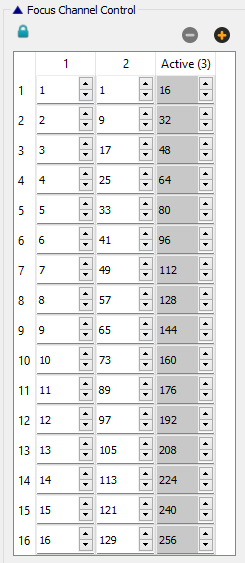
Focus Channel Control
 |
| iD2 Focus Channel Interface |
Use the table to create a custom column of channel numbers to include in the focus
channel set. Use the column buttons  to add
or remove columns.
to add
or remove columns.
Double click the column header to choose the "Active" set of channels to return in the focus channel stream. The column will have brackets, like column [ B ] in the example above.
Click the range buttons  to cycle through
groups of 16 channels at a time on the selected column.
to cycle through
groups of 16 channels at a time on the selected column.
Use undo/redo buttons  to revert changes to
the focus channel table.
to revert changes to
the focus channel table.
Click the lock icon  to lock the currently active column.
iD2 Options
 |
| iD2 Interface |
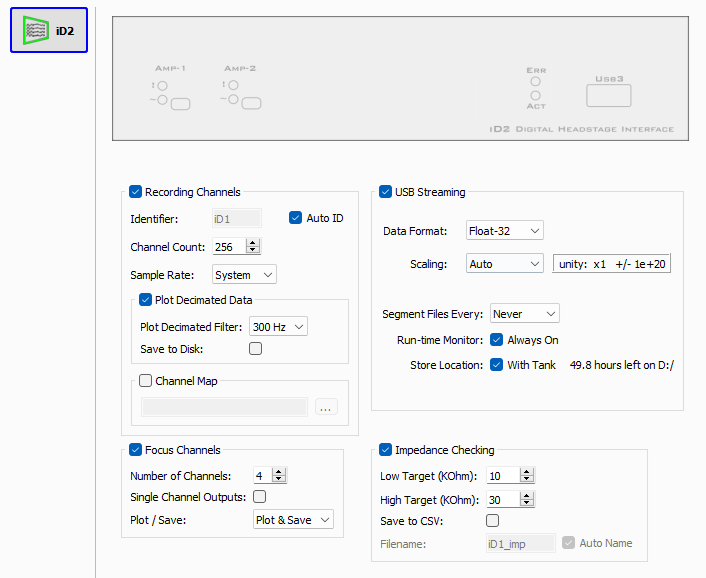
Select the total Channel Count to return from the iD2. This is the sum of all headstages that are connected to the iD2 that you want to read (up to 256).
There are selectable Sample Rate options of ~750 Hz, ~1.5 kHz, ~3 kHz, ~6 kHz, ~12 kHz, ~25 kHz, or system rate (maximum ~25 kHz). The lowest practical rate improves noise performance.
Channel Map
Set a Channel Map to rearrange the channels on the iD2 before they are returned to the processor. The format of the CSV file for specifying the channel map is:
{Synapse Channel},{Headstage Channel}
{Synapse Channel},{Headstage Channel}
You do not have to map all the channels, and you can list the map in any order.
Impedance Checking
The Impedance Check option adds a run-time interface for enabling the impedance checking built into the Intan headstage.
Define the Low Target and High Target impedance thresholds for controlling the color of each channel LED in the runtime interface. This is used to intelligently control the impedance checking circuit on the headstage based on your target impedance.
Save to CSV logs impedance values into a CSV file stored within the block folder, whenever an impedance check runs.
iD2 Runtime Interface
 |
| iD2 Runtime Interface |
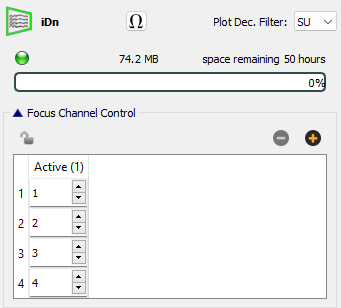
Intan-based headstages can sometimes get into a bad state if the impedance changes
quickly (See TN0985). Click the red arrows
 to reset the headstage without power cycling the
iCon. This takes less than a second, during which time the data will be flat.
to reset the headstage without power cycling the
iCon. This takes less than a second, during which time the data will be flat.
Runtime Impedance Checking
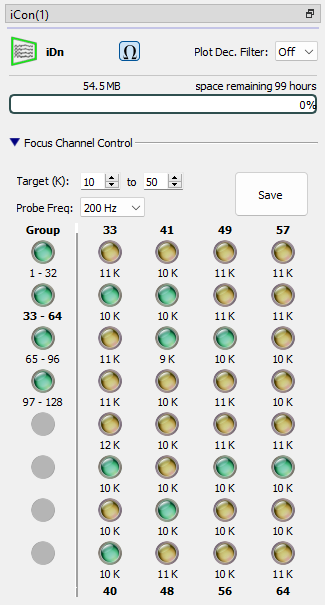
Click the Impedance button to switch the iD2 into impedance checking mode.
 |
| iD2 Impedance Check Interface |
Users can select a Probe Frequency of 24 Hz, 48 Hz, 95 Hz, 191 Hz, 381 Hz, 763 Hz, 1526 Hz, or 3052 Hz for the impedance check. Take care that you do not choose a frequency that is beyond the Nyquist frequency (~1/2 the Sample Rate defined during designtime).
The iD2 loops through the banks of channels and updates the impedance values for each channel, coloring the LED depending on its impedance relative to the high and low target impedances. The Group LEDs display the highest value for each set of 32 channels. Double-click on a Group LED to actively display that set of 32 channels.
Click the Save button to log the current impedance values to the CSV file.
iD3 Options
 |
| iD3 Interface |
Select the Max Channels to read from the iD3. During runtime you can choose a subset (regions) to record from, up to this limit (max 384).
There are selectable Sample Rate options of ~750 Hz, ~1.5 kHz, ~3 kHz, ~6 kHz, ~12 kHz, ~25 kHz, or system rate (maximum ~25 kHz). The lowest practical rate improves noise performance.
Choose to record LFP, SU, or combined LFP & SU. The iD3 combines the LFP & SU into a single waveform for visualization. During iD3 USB Streaming storage, you can choose to keep them separate with the "Raw Packed" format.
Neuropixels Probe
Select your Neuropixels probe model. This informs the site selection interface of the probe geometry and the iD3 of the correct channel map to use.
Choose the Ref Mode to use with this probe (External, Tip, or Internal).
The calibration file is included with the probe, and should be copied into the
C:\TDT\Synapse\NPCalFiles directory.
The Neuropixels v1.0 probes have 960 or 4416 channels to choose from, but only 384 channels can be streamed from the probe at a time. Use Site Selection to pre-configure the regions of the probe that you want to record from. The same interface for selecting recording sites is available at run-time. See Site Selection for more details.
Site Selection Options
Choose to save the site map and / or region info during run-time. The Auto Save option
logs an entry at the beginning of the recording and after the regions have been stable for ~10 seconds.
The NPSiteSpec.csv file in the block folder shows the sites that are streaming to disk, and changes
to the region locations are held in the NPRoiSpec.json file.
iD3 USB Streaming
The one difference between the iD3 and iD2 in terms of USB Streaming is the data formats. The iD3 has a "Raw Packed" format that combines the LFP and Single Unit data into one single value that is saved to disk. The MATLAB SDK and Python SDK automatically split the data into separate LFP and SU arrays during import.
iD3 Runtime Interface
 |
| iD3 Runtime Interface |
The Probe serial number is shown at the top, and the Site Selection interface from designtime
is available. The  button moves the site selection
interface to a new window so you can make it larger.
button moves the site selection
interface to a new window so you can make it larger.
Site Selection
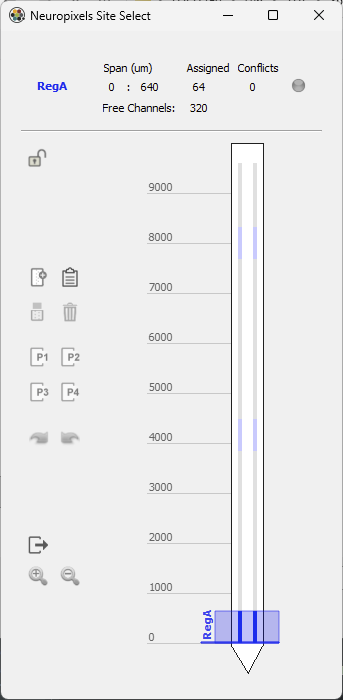
The site selection dialog is available at designtime or runtime and is used to configure the channels that you want to save (up to 384) from the probe.
 |
| Site selection dialog |
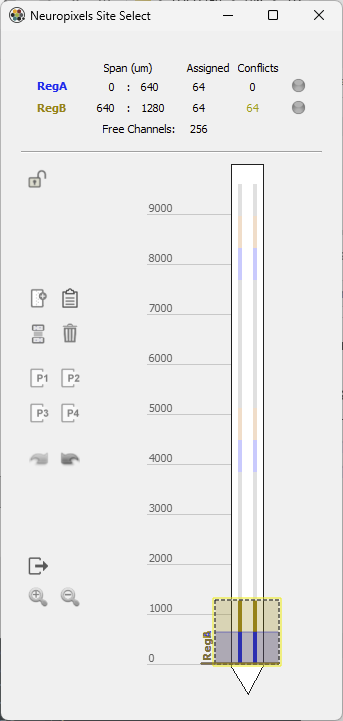
The default is a single 64 channel region (RegA) at the probe tip. Since the Neuropixels probes are multiplexed, other sites on the probe body that share the same ADC as the selected channels in the region become unavailable. You can see in the probe image there are light blue sites near the middle and top of the probe. These share the same ADC channels as the tip sites that are currently selected, so they become unavailable. As you move the regions around, you'll see the unavailable sites update as well.
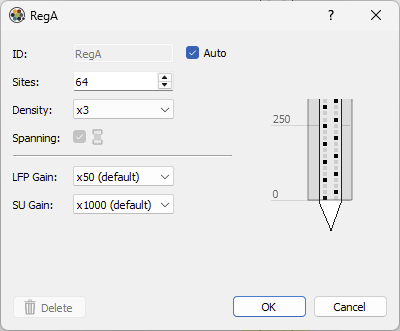
Double-click the region box to open its settings. Here you can adjust the number of sites and use the Density setting to automatically select sites within the region according to that spacing. You can also adjust the gain for the channels inside that region.
 |
| RegA settings |
Click this button  to add a second region (RegB).
 |
| RegB added |
It is also 64 channels and is also added at the tip. You can see that it has 64 channels conflicted with RegA (the region is highlighted in yellow and the conflicting channels are shown at the top of the dialog), and has therefore expanded itself to include the next 64 channels above RegA.
Double-click RegB to see its settings.
 |
| RegB settings |
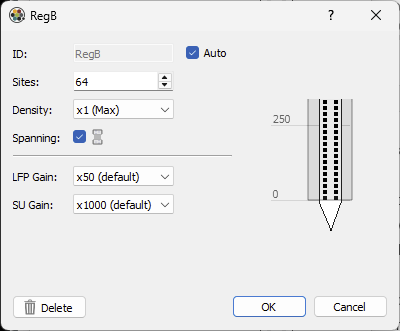
There is a new "Spanning" setting that is enabled for regions other than the first. Spanning means the region is allowed to jump over unavailable sites in order to fill its site allocation. The sites could be unavailable either because another region without the Spanning setting is using them, or they are sites that are shared ADCs on the probe with sites that are taken.
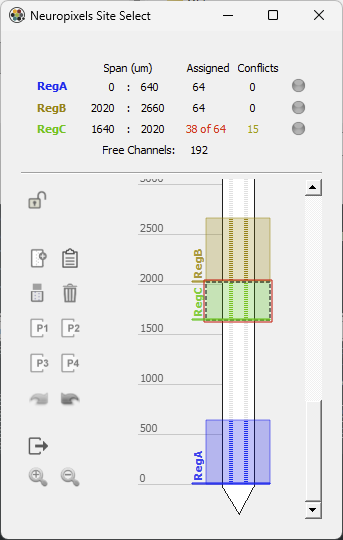
In the example below, RegB and RegC have Spanning disabled, and RegC has a conflict because RegB is given priority over the channels, and RegC can't expand to fill its specified number of channels.
 |
| Region conflict |


iD3 Flow Plot
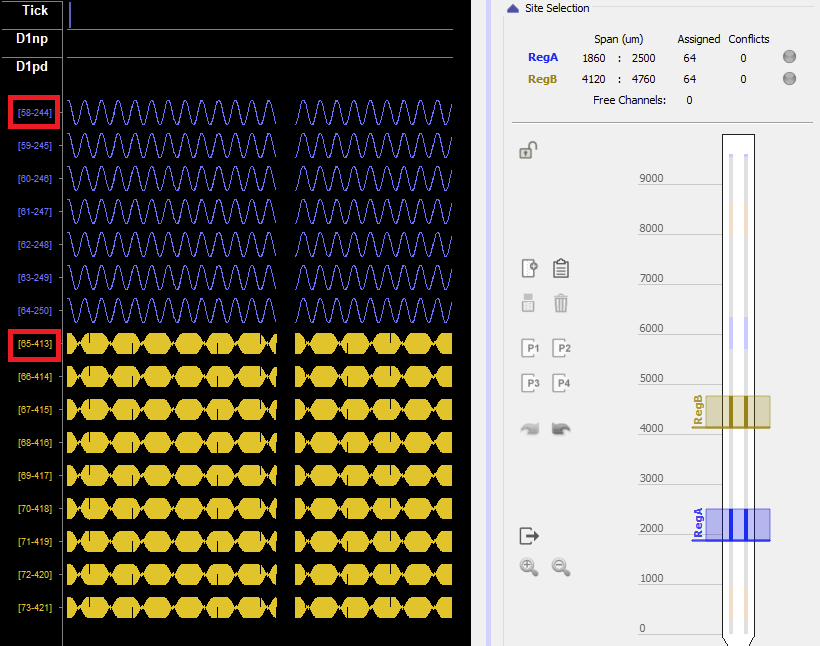
The iD3 returns a subset of channels to disk, selected by the Site Selection. The focus channels are numbered relative to this subselection. To make it easier to see what site is selected as a focus channel, the site number is shown in the first column of the focus channel table and the name of the trace in the Flow Plot view
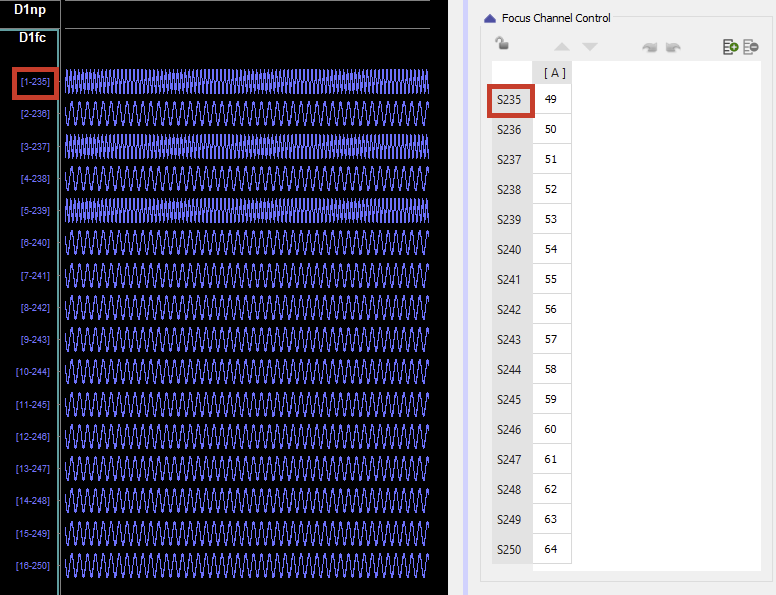
The Preview Data in the Flow Plot shows the channel number on disk as well as the current site number. The channels are color-coded by region.