Runtime
This section covers run modes, persistence in the Flow Plot, tank/block naming
prompts, and log files.
Controlling an Experiment
Runtime Modes
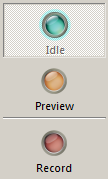
The control buttons allow the user to run or halt the experiment. They are
enabled or disabled (grayed out) based on the available choices.
| Mode |
Description |
| Idle |
Devices are not loaded and are not running. |
| Preview |
Data is saved to a temporary block in the tank.
Users can examine data in the Flow Plot. This allows users to modify parameter values before starting the experiment.
Data is deleted when switching to Idle mode. |
| Record |
Devices are loaded and running and data is saved to the tank. The Experiment and Subject must be configured before the Record button becomes active. |
| Standby |
Disabled by default and enabled in the Synapse Preferences. In this mode devices are loaded and running but signals are not being acquired and saved to disk. Persistence values changed in Standby mode are saved to the database. |
Flow Plot
 |
|
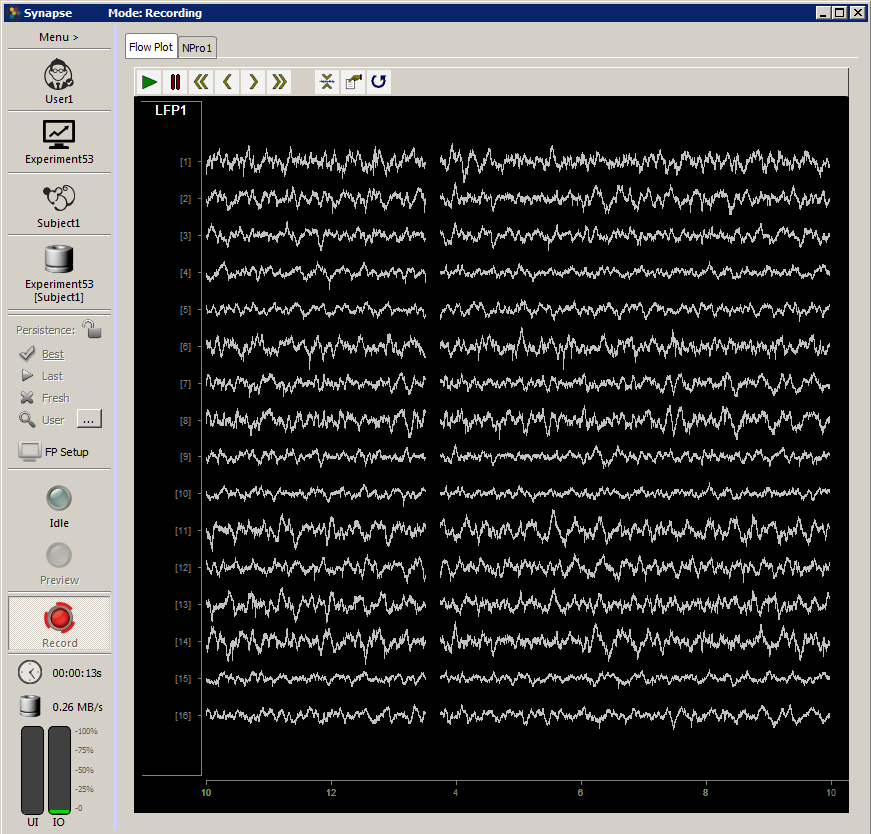
Runtime Window |
The Flow Plot window is automatically displayed in Preview and Record modes for
fast, easy visualization of data.
The Flow Plot Tab
The primary plot includes a default plot configuration for each type of data
being recorded. Users can adjust the plot settings to refine the display. The
example plot above shows a subplot labeled LFP1 that displays 16 channels of
streamed biological data using the Neural Stream Processor gizmo.
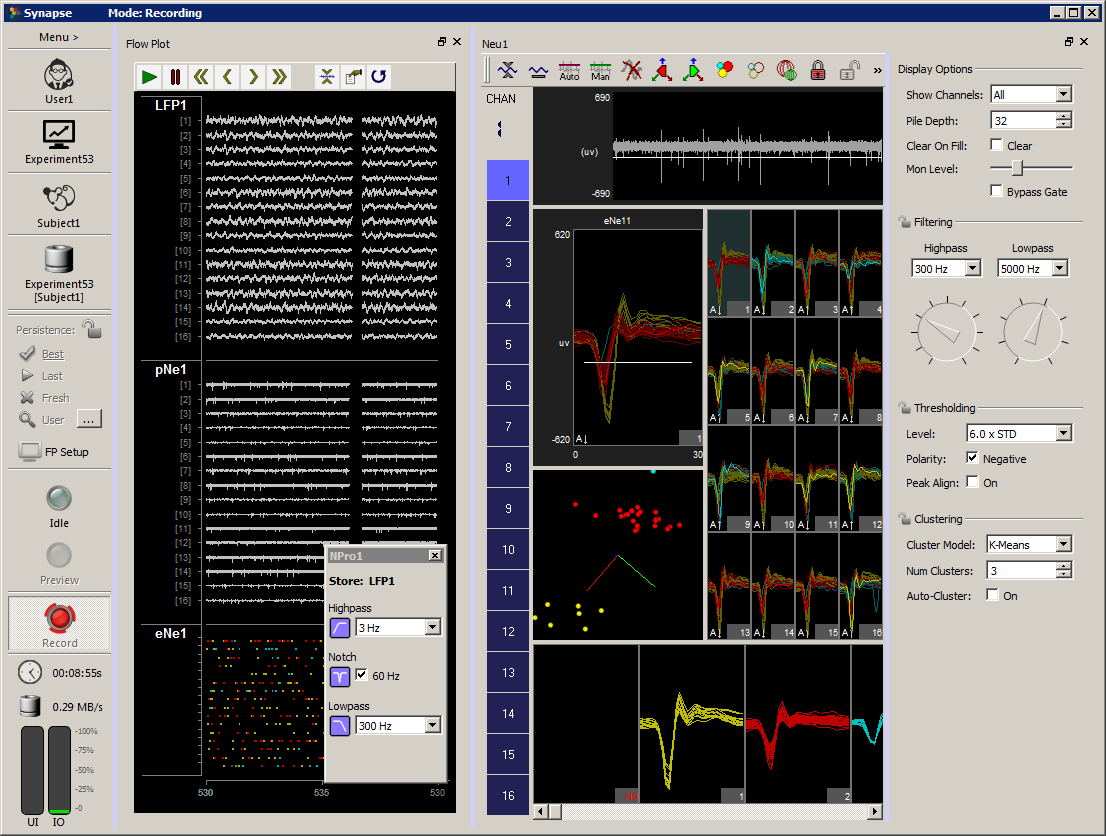
Other Tabs
Many gizmos add a tab to the tabbed window. The added tab contains runtime
control features such as threshold and filtering controls.
Working with Tabs
Tabs can be floated, split, and merged back into the tab framework. Click and
drag a tab to float and reposition the window. Right-click a tab then select
an option on the shortcut menu to split the main window.
 |
|
PCA Spike Sorting and Neural Stream Processor Interfaces |
Persistence
Any changes to the run-time settings are saved with the Experiment and Subject
in the Synapse database. This allows you to The Persistence options on the left
toolbar determine how these run-time parameters are saved and reloaded.
| Mode |
Description |
| Lock |
Locks the currently selected persistence. Otherwise the persistence selection always returns to Best when the experiment ends. |
| Best |
Uses the last settings of any runtime controls for the current experiment and user/subject |
| Last |
Use the last settings from the previous recording, regardless of subject or experiment. This is useful if you are using the same subject with a new experiment. For example, if you have PCA space sorting parameters defined for the subject and want to use them in a different experiment. |
| Fresh |
Don't load any persistence, use the default experiment settings instead |
| User |
Launch the History window. Right-click on a previous recording and choose "Use starting state" or "Use ending state", or right-click in the Changes list at the bottom to select a subset of changes from that recording to use for the next recording. |
| RT Layout |
Choose the window layout configuration. See Layout Persistence below. |
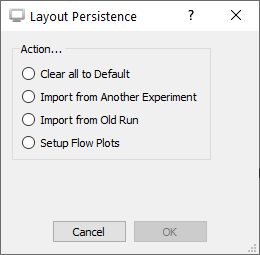
Layout Persistence
Information about the window layout and Flow Plot settings (scale factors, plot
positioning, etc) is specific to the User and is separate from experiment
persistence information. Options are accessible in the RT Layout button. You
must have a named User for the layout to be saved.
 |
|
Layout Persistence Dialog |
| Option |
Description |
| Clear all to Default |
Reset everything to the default layout and Flow Plot configuration scaling |
| Import from Another Experiment |
Choose a previous User and Experiment combination from the Synapse database to load the layout from |
| Import from Old Run |
Load the layout from a previous recording. This uses the block folder directly from disk and does not need the Synapse database for this. |
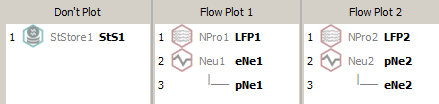
| Setup Flow Plots |
Configure the ordering of the stores for the current experiment within the Flow Plot. This option also lets you split out different stores to entirely different Flow Plot tabs. This is useful for organizing the layout, particularly when doing multi-subject recordings. Right-click + drag a store name to another plot to make a copy. |
 |
|
Multi-Subject Example Layout |
During run-time, the RT Layout button turns into an FP Setup button, which
allows you to edit the location of the stores within the Flow Plot(s) and to
hide them altogether.
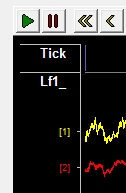
A toolbar at the top of the Flow Plot allows the user to control plot animation.
The toolbar contains the following commands:
| Icon |
Description |
 |
Play |
 |
Pause |
 |
Scroll back by plot window width (e.g. if span is set to 60 seconds, this button will scroll back in 60 second chunks) |
 |
Scroll back (increments of span/10) |
 |
Scroll forward (increments of span/10) |
 |
Scroll forward by plot window width |
 |
Auto Scale all plots |
 |
Data Monitor Setup (launch dialog) |
 |
Refresh |
Additional commands for scaling and shifting plots are available from a right-
click shortcut menu on the Store name in the plot.
| Shortcut |
Description |
| Auto Scale |
Scale the display so that it best fits in the available subplot area. |
| Scale Up/Down |
Incrementally scales the display up or down. |
| No Shift |
Resets the y-axis center to 0. |
| Shift Up/Down |
Shifts the display up or down in the subplot window. |
| Make larger/smaller |
Makes the available subplot area larger or smaller. The other plots are resized accordingly. |
Plot Display Options
Users can change the plot type, modify the number of channels viewed, and choose
to color traces by channel or sort code in the Display Options dialog.
To modify the display options:
Data Monitor Setup
Users can change settings related to the time span and tracking of the plot
window in the Data Monitor Setup window.
Click the Data Monitor button on the plot toolbar to view data monitor settings for the plot.
| Setting |
Description |
| Time Span Control |
|
| Span |
Set the time span (sec) of the plot window. |
| History |
Determine how much plot history will be available to view.
Note how the memory requirements change as these settings are adjusted. |
| Tracking Mode |
|
| Reference Epoch |
If a reference epoch is selected, the left side of the Plot window will always coincide with the start of the reference epoch event. |
| Time Axis Overlap |
Set the amount of the time axis that is repeated when the plot rolls over. For example, if the span is 10 seconds and Time Axis Overlap is set to 50%, the plot will show seconds 0-10, 5-15 etc. |
| Time Display Mode |
Set the display units of the time axis. |
| More Settings |
Press Shift + Ctrl and double-click the dialog box to display additional settings for the plot appearance, such as background color and labels. |