Designtime Reference
When you launch Synapse, you see a streamlined user-interface that automates all but the highest level set-up tasks for you. This is the designtime interface where you can make choices about things like what type of data to collect and what threshold, sorting, or other processing tasks to include in your experiment.
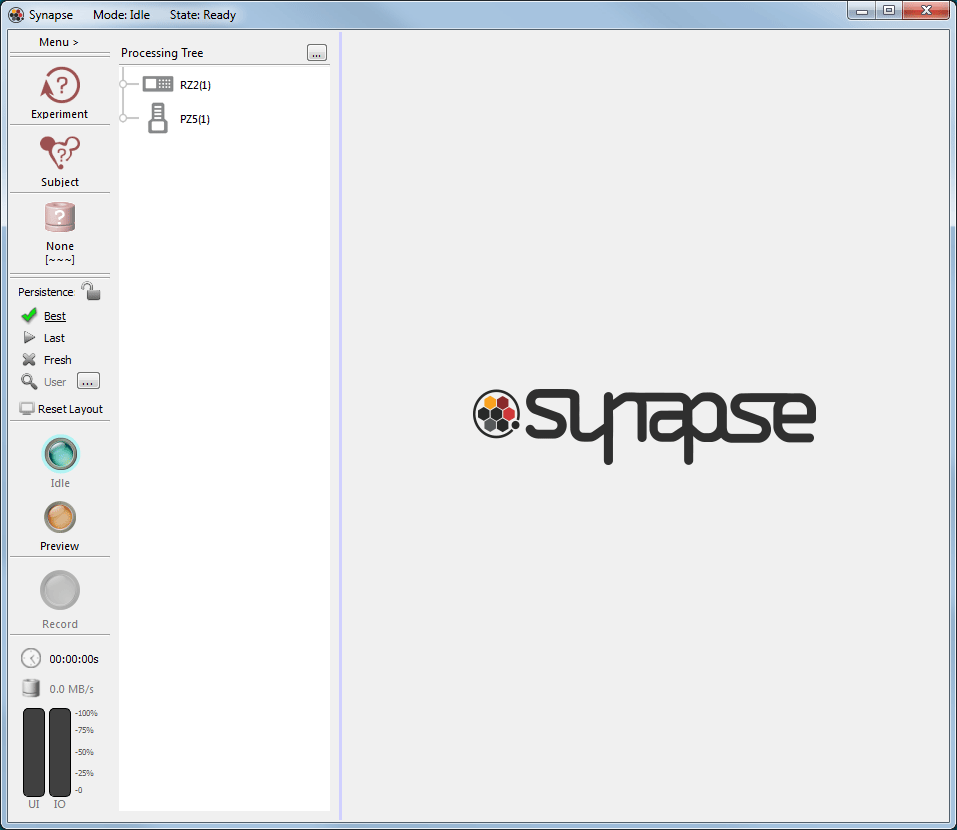 |
| The Synapse Designtime Window |
The window is divided into three areas:
-
The Command Bar contains the most often used elements of Synapse.
-
The Processing Tree displays a graphical representation of your experiment.
-
The Details Area displays setting and configuration options at designtime or plotting and control windows at runtime.
At each step of the design process, Synapse uses information about your hardware and selections you've already made to show only the relevant choices. Once added, you can review and modify the settings in the details area. Often, you won't need to make any changes at all. While Synapse supports drilling down to every detail of how the system works, it has also been designed to make that unnecessary for most Synapse users.
The Processing Tree
The Processing Tree is both a graphical representation of the processing tasks that make up your experiment and a design tool. The tasks added to the tree along with how they are ordered and connected forms the processing instructions that will be loaded to the hardware at runtime. Each tree can have many parts or branches.
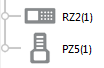
Devices with input/output functionality form the trunk of the tree. They
represent the starting point (or potential starting point) for a branch.
RZ devices appear in the Processing Tree to represent their front panel analog
or digital inputs.
Acquired biological signals are often input by a PZ amplifier, so it also
appears on the trunk of the tree.
Important
If an input/output device does not show up automatically in the Processing Tree, you will need to edit the rig. See The Rig.
Tasks, such as filtering, signal processing, and data storage form the branches of the tree diagram. They are added to the device that will be used to input or output the signals associated with a particular task.

Click the triangle/arrow to expand or collapse a branch.
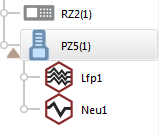
Biological signals are typically acquired on a PZ amplifier; so neural processes, like spike detection, are added to the PZ in the tree.
Multiple tasks can be added to any branch, in parallel or one after another with
tasks ordered logically.
Mouse over a device to see how the hardware devices are connected.
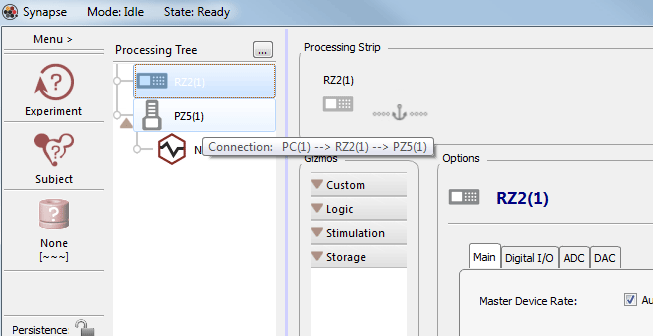 |
| Context Sensitive Hardware Connection Tip |
Using the Processing Tree
The Processing Tree is a simplified view of the experiment. The specifics can be more closely examined in the details area. When an item is selected in the tree, the details area is divided into three sub-areas: the Processing Strip, the Gizmos list, and the Options area.
The information displayed in these three subareas is specific to the selected item or branch:
-
The Processing Strip - displays a drilled down look at the corresponding branch of a signal or data path, following the first inputs of each gizmo in the path.
-
The Gizmos list - displays tasks that can be added to the selected item
-
The Options area - displays configuration options for the selected item
 |
| Synapse Designtime Window |
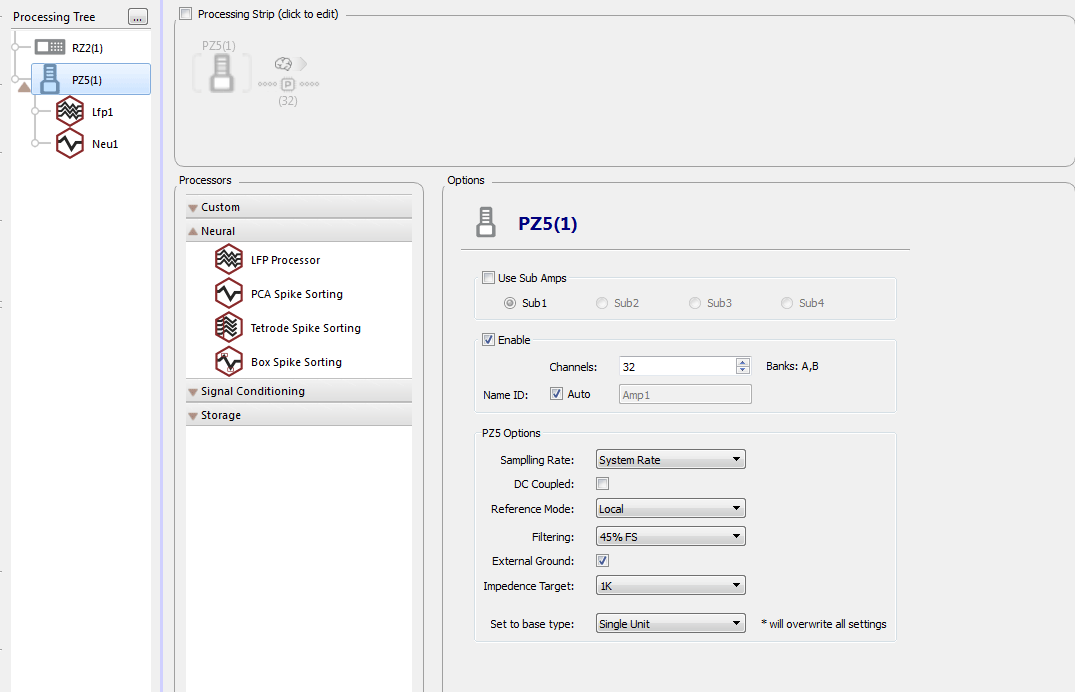
Selecting a hardware device in the Processing Tree updates the Gizmos list to show only the tasks appropriate for that device and displays configuration information for the device in the Options area. This information is saved as part of the experiment and is also referred to as a HAL (Hardware Abstraction Layer) because it gives Synapse everything it needs to manage the hardware- related low level programming tasks.
Similarly, selecting a gizmo in the tree displays the settings for the gizmo, typically arranged on tabs in the Options area.
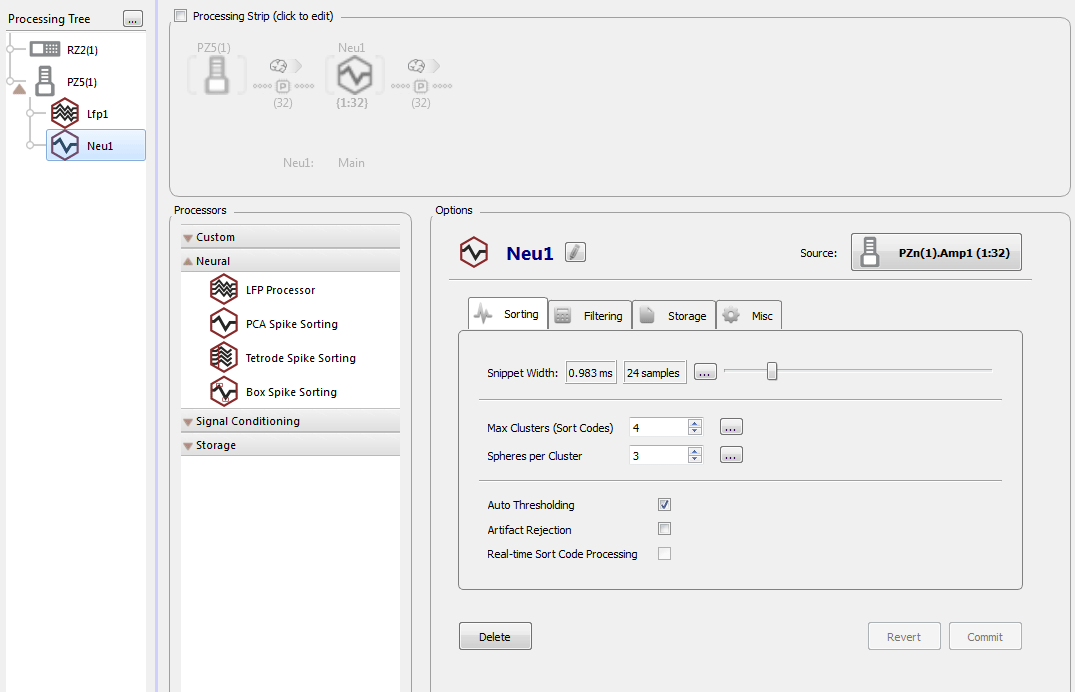 |
| Designtime Window with the Neu1 Gizmo Options Displayed |
To reset a device or gizmo:
- Right-click the corresponding icon in the Processing Tree and click Reset to Default on the shortcut menu.
To add a previously unused HAL:
-
Right-click a related icon in the Processing Tree and click Add HAL on the shortcut menu.
This option allows you to add a HAL for a device that is present in your Rig, but previously not in use in the experiment. By adding the HAL directly in the Processing Tree, you avoid returning to the Rig Editor which resets all of your device HALs.
The Gizmos List
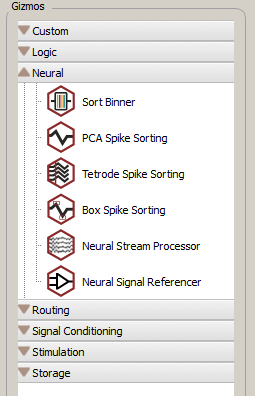
Only gizmos that can connect to the currently selected object in the Processing Tree are shown. Select a different item in the Processing Tree and different gizmos will be displayed.
The gizmos are grouped by task type, such as storage or signal conditioning. For the full list of categories and descriptions, see the Gizmo Categories Reference.
Double-click a gizmo to add it to the selected item in the Processing Tree.
Gizmos in the list are like menu choices, they can be added to the Processing Tree more than once and for more then one input/output source.
The Options Area
Name/Source/Block Diagram
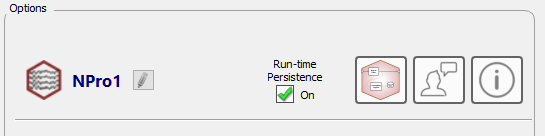
The top section of the options area differs slightly depending the device or gizmo selected. It typically displays an editable device or gizmo icon and name. It may also display the Primary Source for the device or gizmo and the Block Diagram toggle button.
The Gizmo Name

The gizmo name is generated automatically for you and is based on the type of gizmo selected. If needed, click the Edit icon to modify the name. The name must be at least three letters long and the first three letters are used to form the Storage ID for any related data stores in the data tank. The field turns red if the minimum three letters are not included.
Important
Changing the name of a gizmo that includes data storage will change the name(s) of the storage ID(s) in the data tank. Synapse will display a warning dialog box the first time you attempt to do this. For sanity, changing the store name after you have started collecting data with the experiment is not recommended.
Run-time Persistence
When Run-time Persistence is turned off for a gizmo, the persistence (for that gizmo only) is always 'Fresh', meaning the designtime settings are always loaded when the recording begins. It overrules whatever the global persistence is set to.
If this box is checked, the gizmo follows the global persistence rules.
The Block Diagram Button

The Block Diagram button provides access to source settings and the block diagram. See the Gizmo Reference for more information.
The Feedback Button

Send TDT feedback on Synapse, this gizmo, or anything else you want to let us know about.
The Help Button

Opens the Synapse Manual to the current gizmo to learn more about it. By default it
opens the online manual in a web browser. If internet is unavailable it opens the
local PDF in C:\TDT\TDTHelp.
Global Options Buttons
Located below the options tabs and applied across all tabs.
-
Delete button - Delete the gizmo from the Processing Tree.
-
Revert button - Return to the last saved or 'committed' state. You can also use Shift + F7 keyboard shortcut to revert.
-
Commit button - Save changes on all tabs. You can also use F7 on the keyboard to force a Commit.
Experiment Changes and the Revision Log
In Synapse, the experiment is saved each time you make or "Commit" a change. If you need to roll back a change in the experiment design, you can do so in the Experiments Revision Log.
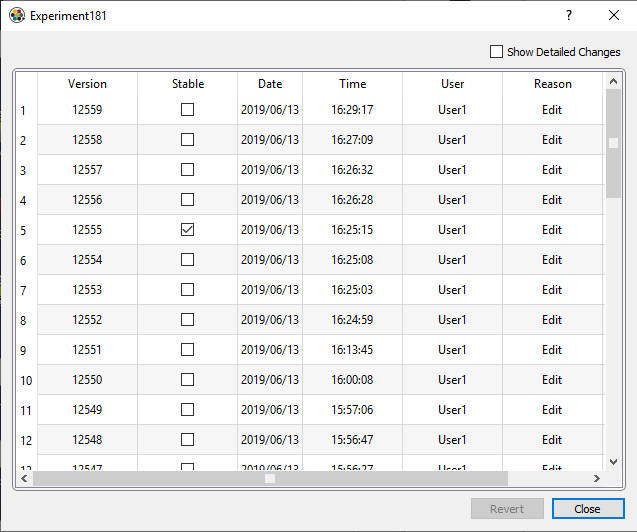 |
| Experiment Revisions Log |
You can sort the information by clicking a column header. When you find the version you need, select it and click the Revert button. Use the Show Detailed Changes checkbox to add a details column with a description of the changes that were made in that revision.
If you are continually making changes but want to revert back to a specific version, check the Stable checkbox to flag a particular version you often revert back to. This is a visual indicator for your record only.
Opening the Revision Log
If you have the experiment open and it has a revision history, a "Revision Log" command is added to the Experiment Button menu.
If the experiment is not open:
-
Click the Experiment Button and More.
-
In the Experiment Selection Window, right-click the experiment icon and click Revision Log.
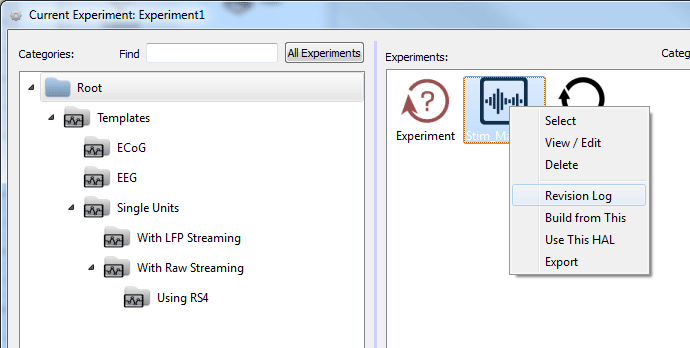
Experiment Selection Window with Experiment Shortcut Menu Shown
The Connections Diagram

The Connections diagram provides a top-level view of experiment design. The diagram is available from the Menu or the Connections button, and can be printed.
Each node shows available inputs and outputs. The color of arrowheads on the connection arrows indicates the data type (such as logic or floating point). The arrows are also labeled with the channel range for any multi-channel signals.
Common data types include:

floating point type

integer type

logical type
The diagram also functions as a debugging tool. You can double-click a node to jump to the selected gizmo or HAL and make changes.
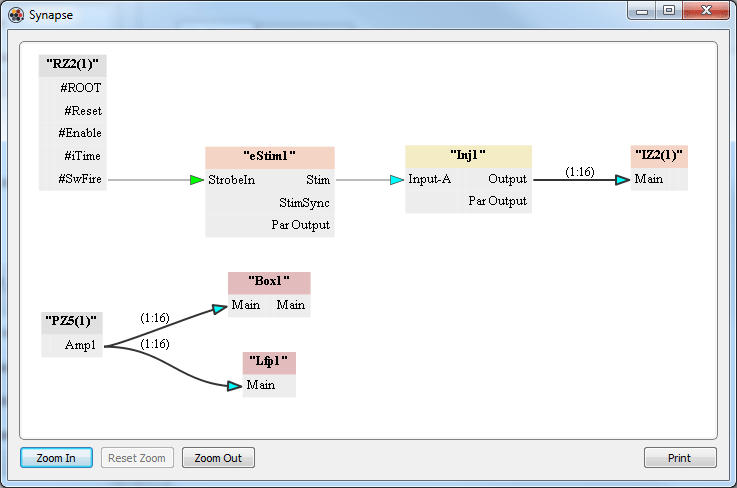 |
| Connections Diagram |
In the diagram above, a logic signal from the RZ2 triggers electrical stimulation. A single channel, floating point signal is passed from the stimulation gizmo to an injector gizmo where it becomes a 16 channel data stream routed to the IZ2 HAL. The diagram also shows data acquired from a PZ5 is passed to two different gizmos for parallel processing.
The Gizmo Slides Window

The Gizmo Slides Window provides a top-level view of the currently selected gizmo. The slides window is available by clicking the '?' button above the Processing Tree.
Each gizmo has a set of slides that show common use cases, example connection diagrams, common inputs and outputs, an overview of the user interface, and more.
When you select a new gizmo, the slides for that gizmo are shown. This is helpful when you are getting to know the user interface and what all the gizmos do.
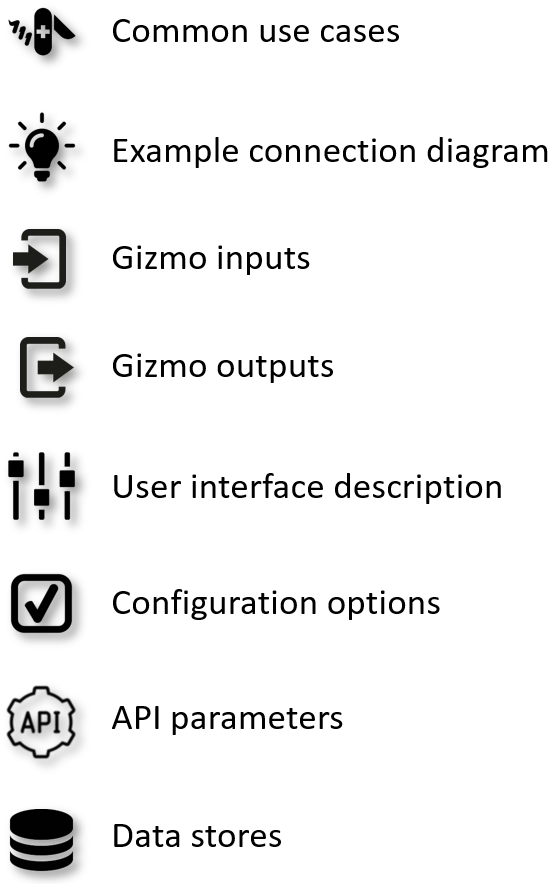 |
| Gizmo Slide Legend |
The Processing Strip
The Processing Strip can be shown as part of the Synapse main window using the Preferences dialog (see Synapse Preferences. It displays a branch of the signal or data path, from the signal source to the item selected in the Processing Tree. The primary purpose of the Processing Strip is to provide information about the signal path at a glance.
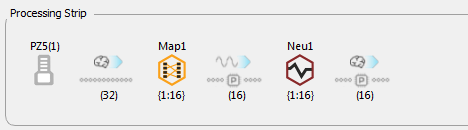 |
| The Processing Strip |
The number of channels in the signal stream are displayed beneath the gray line representing the signal path. The number shown is the number of channels in the signal at the output of the device or gizmo to the left. In the illustration above, the number of channels at the output of the Map1 gizmo is 16. The number of signals fed into the process was 32, so the illustration shows that the number of channels mapped and passed through does not include all channels.
The numbers below a gizmo display the first channel number in the signal and the number of channels in the signal, that is {first channel:number of channels}. Many gizmos allow the user to change the channel range. This makes it possible to split up a multi-channel signal into several different branches so they may be processed differently.
Menu and Command Bar
Main Menu
Click Menu to display.
Categories
Click corresponding button to display. Menu options are available in IDLE mode only, unless otherwise specified.
Templates
Templates are experiment files that have been created by TDT. Each template is a basic working experiment that can be run as configured, but you will more likely begin with the template and modify it to meet your needs. Templates have been designed to work with rigs suitable for the type of experiment. When opened, Synapse will attempt to adapt the configuration to your hardware rig and alert you to any conflicts it is unable to resolve automatically.
Synapse Preferences
To view the Synapse Preference dialog:
- Click Menu at the top of the bar and then click Preferences.
General
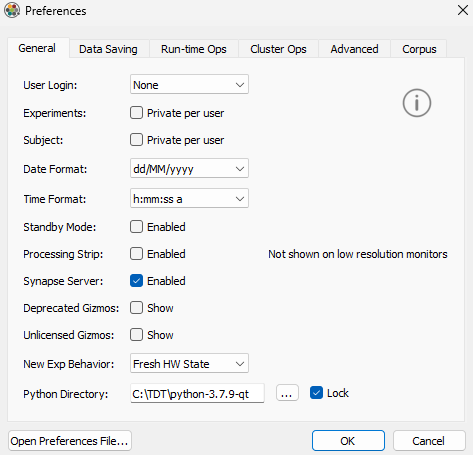 |
| Preferences Dialog, General Tab |
Data Saving
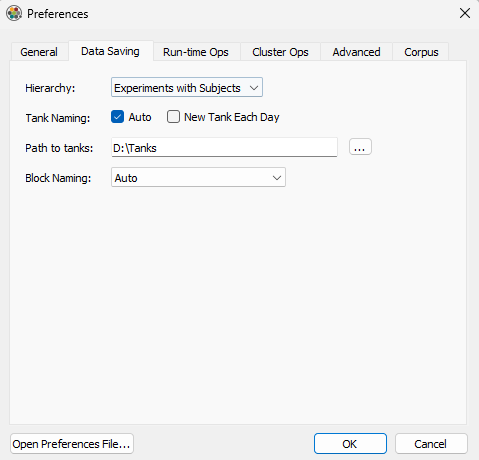 |
| Preferences Dialog, Data Saving Tab |
Run-time Ops
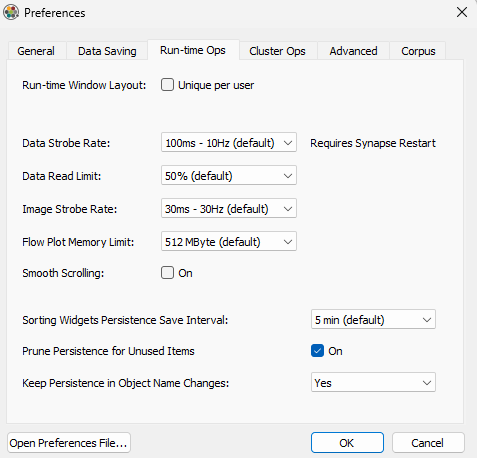 |
| Preferences, Run-time Ops Tab |
Cluster Ops
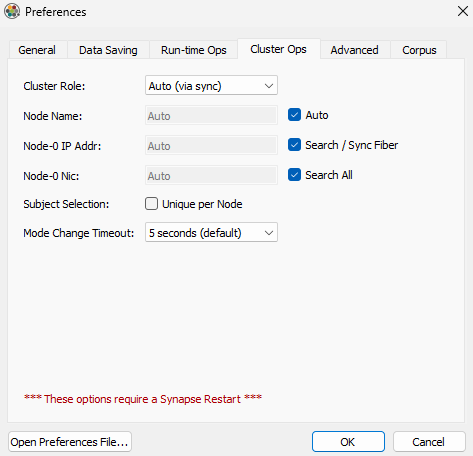 |
| Preferences Dialog, Cluster Ops Tab |
These settings are only used in Cluster Processing mode and are not available in Synapse Lite. See Cluster Preferences for more information.
Advanced
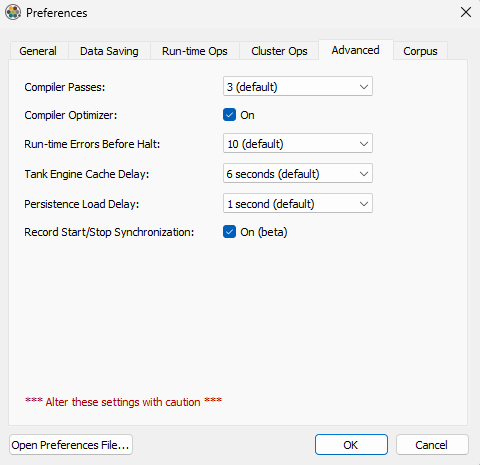 |
| Preferences Dialog, Advanced Tab |
Corpus
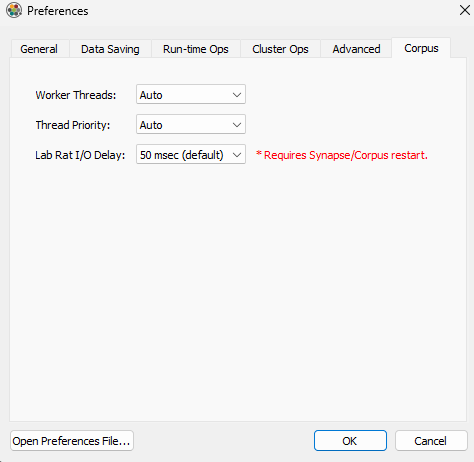 |
| Preferences Dialog, Corpus Tab |