Tetrode Spike Sorting
Common Use Cases

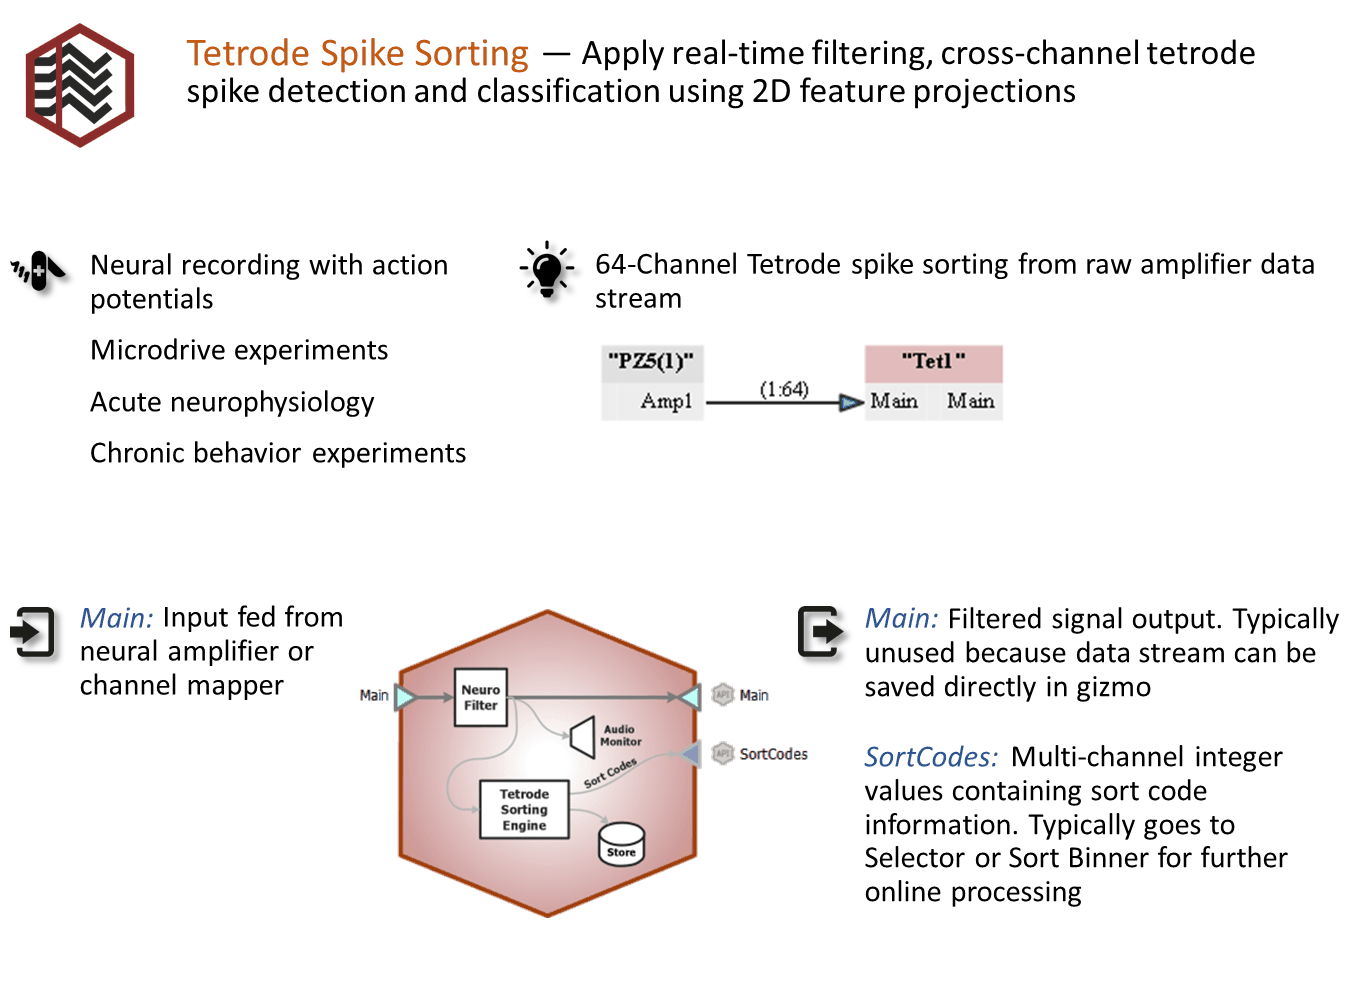
Real-time filtering, cross-channel tetrode spike detection and classification in a fully customizable 2D feature projection. Use this gizmo for sorting spikes using tetrodes. Commonly used for cell isolation, tetrode sorting provides high spatial localization of nearby units.
Gizmo Help Slides
Reference
The Tetrode Spike Sorting gizmo performs filtering, thresholding and online tetrode feature space spike sorting and storage on multi-channel neural signals at sampling rates up to 50 kHz.
Data Storage
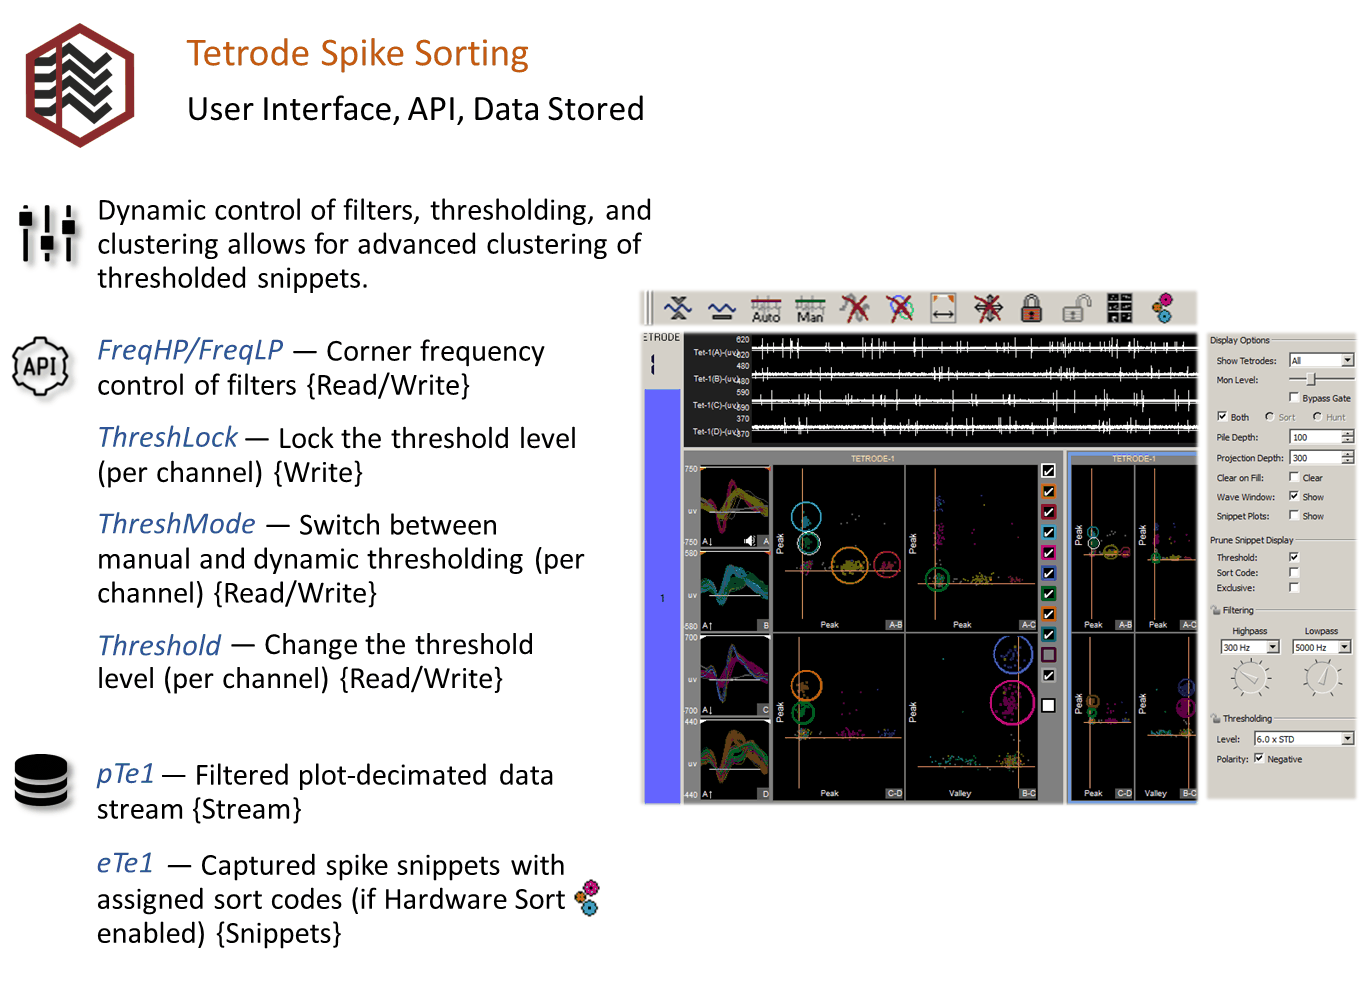
This gizmo generates two types of data for storage: snippet data (includes timestamp, short waveform, and sort code) and plot decimated data streams. The stream data generated by this gizmo is a highly decimated version of the waveforms that keeps local maximum and minimum values of the filtered signals, which makes it ideal for visualizing high frequency spike activity on a computer monitor with a fixed number of pixels.
When a waveform crosses a threshold on any channel in tetrode, a snippet on all four channels in that tetrode is recorded. The four snippets are concatenated and stored in the data tank as one large snippet, with a timestamp and a sort code. The sort code is determined by visual spike sorting in the runtime interface.
In plots and in the data tank, each type of data is designated with a prefix: 'e' for snippets and 'p' for streams. You can opt to save only snippets or to disable storage in the gizmo's configuration settings. The sort codes can be configured as an output to be used in other gizmos.
Threshold Detection
At runtime, candidate spikes are detected based on a calculation of the deviation of a waveform from its RMS. By default, the timestamp and position of the waveform in the snippet is dependent on the time of the threshold crossing for the signal. An alternative setting allows waveform timestamp and positioning to be determined by the waveform's highest peak, aligning snippets to their respective peaks. By default, detection is automated and you can make adjustments in the threshold control plot in the runtime window.
Spike Sorting
Each channel within a tetrode is displayed in a separate snippet waveform subplot. Events are projected onto a 2D space by first calculating user-selected metrics for one or two channels and then mapping one metric against another. Up to four 2D feature projections can be used to visualize spike clustering. Users may select from the following metrics: peak, valley, height, energy, non-linear energy, average, area and Slope. User-defined circles in each projection plot determine each cluster's boundaries. Snippets falling inside a circle are given a sort code corresponding to that circle's color.
The interface works in two modes:
Hunt Mode
In hunt mode the projection plots default to peak vs. peak for all six combinations of tetrode channels to provide a general overall picture of activity. Use this mode during electrode placement to search for active neurons.
Sort Mode
After the electrode has been placed, use sort mode to choose new metrics for the projection plots and add sort circles to these plots.
This gizmo allows simultaneous recordings from multiple tetrodes. The multi- channel input stream must be arranged in groups of four; each group corresponding to one physical tetrode (a Mapper gizmo may be used, see Mapper).
Settings for configuring the maximum number of sorting circles per projection, thresholding method and window width of the snippets can be found on the Sorting Tab in the Options area of the designtime interface.
The Runtime Interface
Runtime Plot
Streamed waveform and Snippet plots are added to the runtime window for visualization.
Tetrode Spike Sorting Window
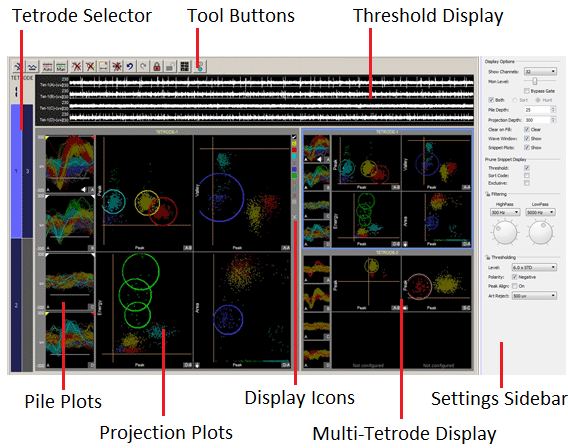
The runtime window includes:
Zoom and Pan
You can zoom any plot to see more or less detail without affecting the actual data.
To change the zoom level, hold down the Shift key and click-and-drag the pointer up or down.
To reset the zoom level, hold down the Shift key and double-click the pointer within the display area.
To pan in snippet plots, hold down the Alt key and click-and-drag to move the snippets vertically.
To pan in projection plots, click-and-drag the pointer to move the view.
Display Scale
To make it easier to see waveform shapes for channels with lower magnitude, you may scale individual channels manually or normalize all channels to fit to a similar scale, all without altering the data being stored.

To normalize all channels, click the Auto Scale button in the toolbar and choose to normalize the display. Each channel is scaled individually to fit around 80% of the signal's vertical size in each plot. An up or down arrow is displayed in the bottom left corner of the plot or subplot to indicate whether the display has been scaled up or down. This does not change the scale of the feature space.
To adjust the scale of a single channel, press and hold down the Ctrl key, and click-and-drag the pointer up or down in the pile plot. While adjusting the display scale, the numeric value in the lower right corner of the channel plot indicates the new scale value.
The gizmo stores two sets of scale factors, one set for sort mode and another for hunt mode. Each set (sort or hunt) of scaling information includes a scale factor for the tetrode and any individual scale factors set for individual plots. This allows you to switch between modes without rescaling or losing scaling information.

To reset the scale for all channels, click the Reset Base Scale button. This does not remove any zoom applied to a plot.
To return all channels of a single tetrode to their base scale, right-click in the wave window and select Reset Scaling - Tetrode from the menu.
To return a single channel to its base scale, right-click the desired pile plot and select Reset Scaling from the menu.
Scaling the Projection Plots
In addition to being scaled when all plots/channels are scaled, the projection plots can be scaled for each tetrode or as individual plots on the shortcut (right-click) menus.
The projection plots also have a base scale which is computed as a reasonable estimate based on the metric combinations and typical data sets.
Because the 2D clusters don't always fit into nice circles for sorting, the projection plot axes can be independently scaled in order to skew the visual data set so that it does fit into a circular boundary.
To independently scale each axis, hold down Ctrl + Alt and click-and-drag the pointer to the left or right to scale the x-axis of the project plot, or drag up or down to scale the y-axis.

To reset the independent scaling for all projection plots in the current tetrode or all tetrodes, click the Reset 2D Plot Independent Scaling button.
Highlighting Traces
By default, the most recent trace acquired is highlighted in all plots throughout the tetrode display area. Alternatively, a group of traces that are of interest can be highlighted.
To highlight a group of traces, hold down the A key and drag the pointer across the desired traces in any pile plot. The selected pile plot traces and their corresponding dots in the projection plots will be highlighted.
This can be repeated to add more selected traces. To remove a group of traces from the highlighted selection, repeat this procedure with the S key.
To clear all custom highlighting from the pile and projection plots of the active tetrode, click the bottom display icon (to the right of the projection plots).
Settings Sidebar
Threshold Control

Click the Auto Threshold button to initiate automatic threshold tracking on all unlocked channels. If auto thresholding is enabled in the designtime interface, real-time tracking will begin on all channels, otherwise the channels will remain in manual threshold mode and the threshold will be set based on a one-time calculation using the current window data and the Thresholding Level and Polarity settings.

Click the Manual Threshold button to enable manual thresholding on all unlocked channels. In manual threshold mode, the threshold bar can be adjusted by clicking and dragging the white bar in the threshold display or pile plot.
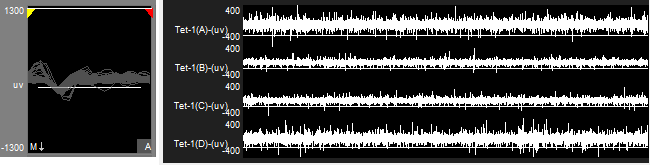 |
| Pile Plot (left) and Wave Window (right), Manual Threshold Mode |
You can also right-click the pile plot at the desired threshold location and choose Set Threshold Here from the shortcut menu to move the threshold to that location on one channel. You have the option to apply this new location to all channels in manual thresholding mode.
Right-click the pile plot or threshold display and use the Auto/Manual Threshold options to change the threshold mode of an individual channel.
Hunt Mode
Hunt mode is designed for use during electrode placement. In this mode, the feature projections show peak vs peak for all electrode combinations to provide a general overall picture of activity.

By default, the runtime interface is in sort mode. To turn on hunt mode, click the Hunt button. All sorting features are disabled in this mode, but scaling and other features are available.
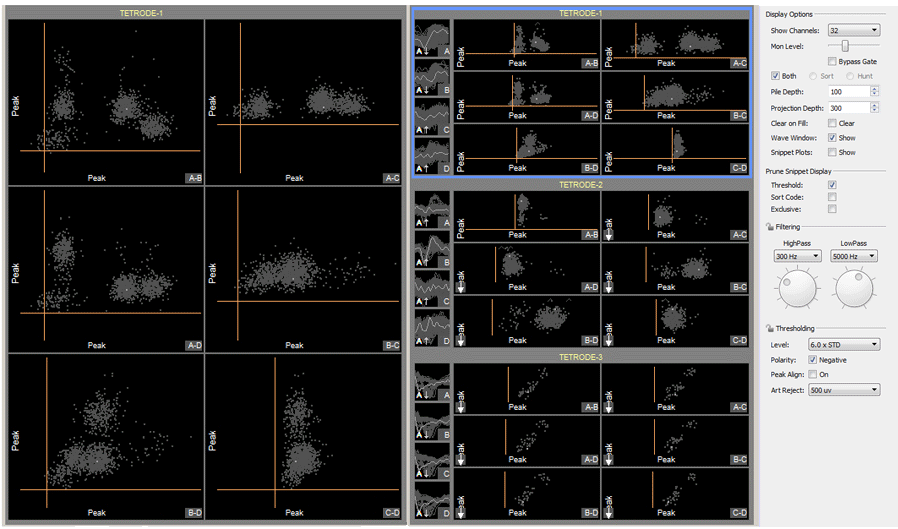 |
| Hunt Mode |
The number of events that are shown in the snippet plots (Pile Depth) and projection plots (Projection Depth) can be configured in the settings sidebar.
To clear all events from the display, press the Spacebar.
You can transfer projections from hunt mode to sort mode to speed up projection configuration. Press the Ctrl key and click the desired projection(s). You can select multiple projections across multiple tetrodes. Then click the Hunt button to turn hunt mode off. You'll be asked to confirm your selections. The display returns to sort mode with the selected projections.
Sorting in the Active Tetrode Plot Display
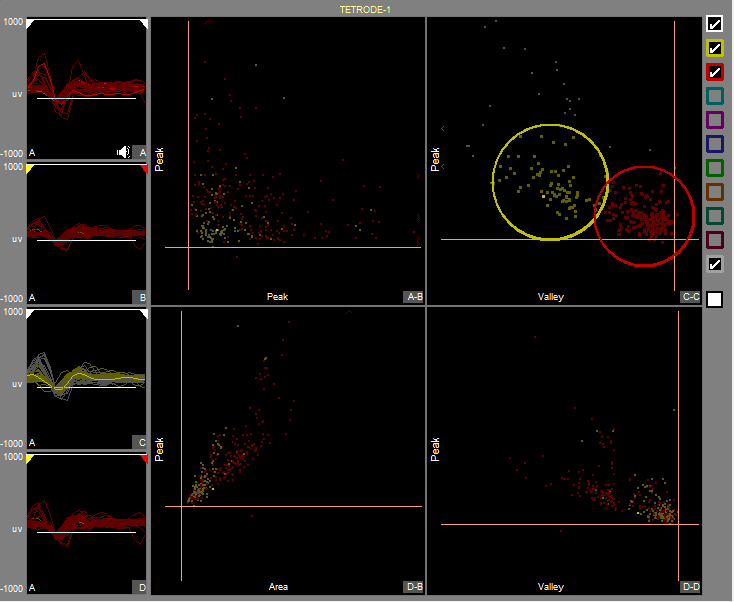 |
| Active Tetrode Display |
The active tetrode display provides an interactive space for online cluster- cutting. Once reasonable thresholds are set, snippets will appear in each of the four snippet plots. The projection plots are created by applying metrics to the waveforms in these pile plots and then plotting one metric versus another in an X-Y plane.

When you are satisfied with the defined sorts, you can send the sorting parameters to the hardware by clicking the Hardware Sorts button and sort codes will be applied to new data as it is acquired in real-time. This toolbar button must be 'pressed' for online sorting to take place on the hardware.

You can lock the plots by clicking the Lock button to protect them from modification.
Pile Plots
Restricting Metric Calculations to a Narrow Window
The marker at the top of the snippet plot indicates the window of snippet data that is used for metric calculations for the selected projection plot. This is called the min-max interval and can be adjusted on-the-fly.

This does not change the width of the window in data storage, which is defined in the configuration options.
Click-and-drag the yellow or red indicators to the desired position to adjust the min-max interval.

To reset the min-max interval for one channel, right-click in the pile plot and select Reset Min-Max Interval. To reset the min-max interval for more channels, click the Reset Snippet Plot Max Min Intervals button.
Projection Plots
The main area of the active tetrode display is divided into four 2D projection plots for dynamic visual spike sorting. Each snippet appears as a single dot in 2D space of one metric plotted versus another. By default, the top left plot will display the peak of the first channel against the peak of the second channel.
Up to four 2D projections can be used to visualize tetrode spike clustering. Each new projection can help to further refine a sort or identify new sorts. You can preview and choose projections using the active tetrode data.
Available Metrics
All metric calculations are performed on the segment of data within the min-max interval only.
To open the Projection Selector, double-click a projection subplot. To add a projection, select a subplot that has not been configured.
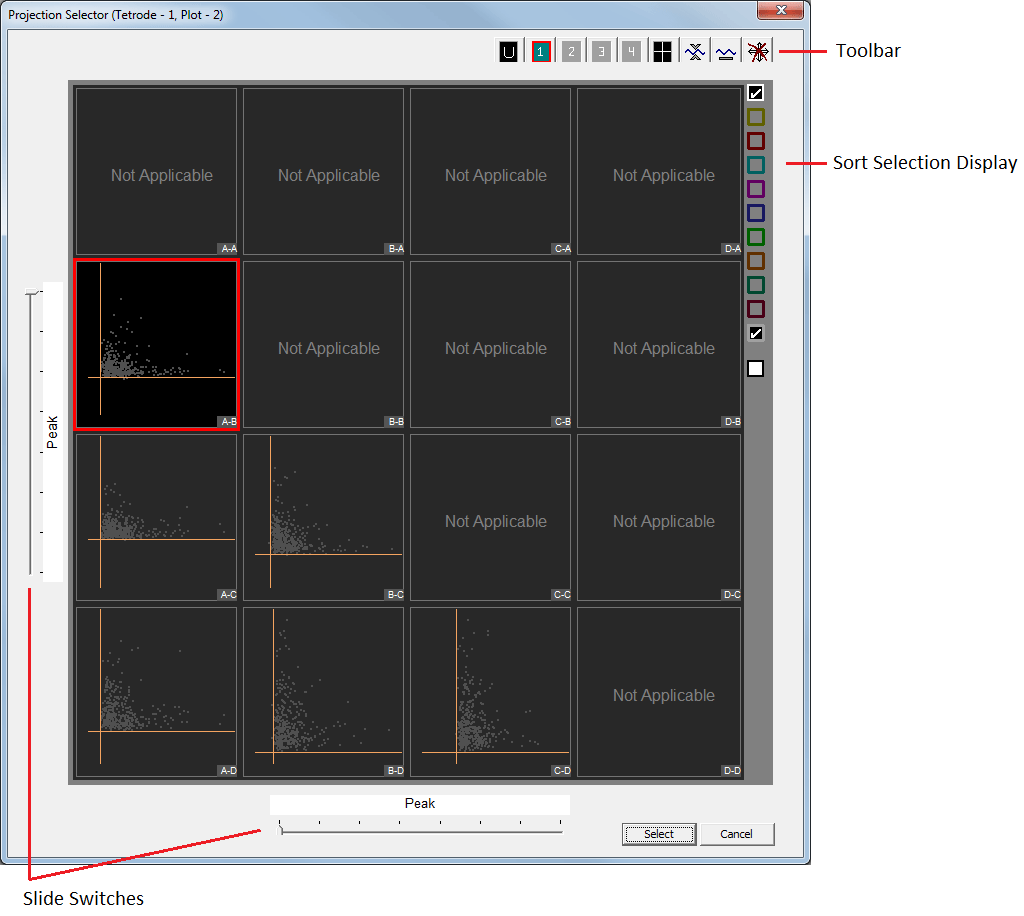 |
| Projection Selector Window |
All possible combinations of metrics between channels are displayed. The letters in the lower-right corner of each plot indicate the x-axis and y-axis channels for that plot. Metric combinations that are already in use in other projection plots for this tetrode will have a solid border around them.
Use the slide switches on the left and bottom edges to chose the Y- and X-axis metrics, respectively.
The Sort Selection Display can be used to toggle the display of individual or all sort codes.


Defining Sorts
You can assign sort codes to their associated snippets by drawing a circle around the desired cluster of points in the plot. Snippets falling inside a circle are given a sort code corresponding to that circle's color. The color of the dot representing that snippet will change to the color of the circle. More than one circle of the same color can be defined in each projection. A snippet falling in any of those same-colored circles will be classified with that sort code.
Because snippets can fall into more than one circle, the sort code assigned to
candidate waveforms can be either (a) the largest value of all circles the dot
fell inside or (b) a mask of all sort codes that the candidate snippet fell
inside. For example, if a snippet falls into a yellow (sort code 1) and green
(sort code 6) circle, then the snippet mask will be 33 (0b100001 = 33). This
assignment option is selected by the user in the Sorting Options tab at
designtime.
A snippet that doesn't fall inside any circles is considered unsorted and has sort code 0 (gray). If there are circles of the same color on more than one projection, a candidate snippet has to fall inside that type of circle in all projections to be given that color's sort code. The total number of circles that can be defined in any one projection plot is set in the configuration options (the default is 12).
 |
| Sorting Interface |
Drawing Circles
The circles you draw in each projection plot determine a cluster's boundaries and shape. Sort codes are applied to snippets using the boundary calculated for each cluster. Hold down the Ctrl key and click-and-drag to draw a sorting circle on the plot.
Sort circles can also be generated by drawing an arbitrary shape around points in a projection plot. Synapse will then attempt to draw circles that will efficiently represent the selected points. Hold down the Alt key and click- and-drag to draw an arbitrary shape that will be converted into sorting circles.
If necessary, the projection plot axes can be independently scaled so that the data points fit into circular clusters. To independently scale each axis, hold down Ctrl + Alt and click-and-drag the mouse to the left or right to scale the x-axis of the project plot, or drag up or down to scale the y-axis.
Filtering the Display by Sort Code
A column of colored squares along the right edge of the active tetrode display serves to filter events by sort code. Check the white outlined box to display all sort codes. Check the gray outlined box to display unsorted events. Hold down the Ctrl key and click a square, to show only that sort code.
Applying Sorts to New Data
Sort codes are not saved to the data tank until sorts are applied by the user. You can re-sort or make adjustments as needed to get the best results.
Click the Hardware Sort button to send the sorting parameters to the hardware and begin saving sort codes to the tank. Sort codes are applied as new data is acquired. While this button is down, changes in sorting parameters in the display will be applied automatically to new data.
Locking Channels
Click the Lock All button to lock the sorting circles for all channels, or right-click individual channels and choose Lock .

Click the Unlock button to unlock all channels, or right-click individual channel plots and choose Unlock.
Keyboard Shortcuts
Tetrode Spike Sorting Configuration Options
Sorting Tab
Settings on this tab apply to the runtime interface and snippet storage.
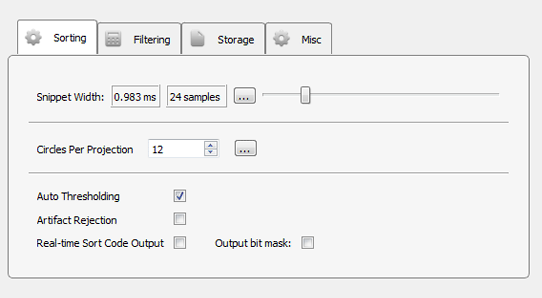 |
| Sorting Options Tab |
Snippet Width Slider
Drag slider to select the desired width (displayed in milliseconds and samples) of recorded snippets (per channel). The actual snippet output will be four times as long.
Circles Per Projection
Set the total number of circles that can be defined in any one projection plot. Lowering this value decreases the processing overhead.
Auto Thresholding
In automatic thresholding, the threshold used to record snippets is adjusted in real-time to changes in each channel waveform's RMS. The previous five seconds of data are used in the RMS calculation.
Artifact Rejection
When artifact rejection is enabled, snippets that contain at least one sample greater than the artifact rejection level set on the runtime interface are ignored.
Real-time Sort Code Output
Make the multi-channel integer stream of uncompressed sort codes available to other gizmos, such as Sort Binner or UDP output.
Note: The sort code output is delayed by (window width + 2) samples from when the threshold is crossed. When artifact rejection is enabled, the sort code output is delayed by an additional window width, so (2 * window width + 2) total samples.
Output Bit Mask
Make the assigned sort code a mask of all sort codes that the candidate snippet
fell inside. For example, if a snippet falls into a yellow (sort code 1) and
green (sort code 6) circle, then the snippet mask will be 33 (0b100001 = 33).
The default behavior is to use the largest value of all circles the dot fell inside as the sort code. If using Sort Binner on the Sort Code output, leave this option unchecked.
Filtering Tab
The gizmo applies a highpass and lowpass filter to all channels before spike detection. The runtime interface includes controls for dynamic adjustments to the filter settings. You also set default values in the Filtering tab.
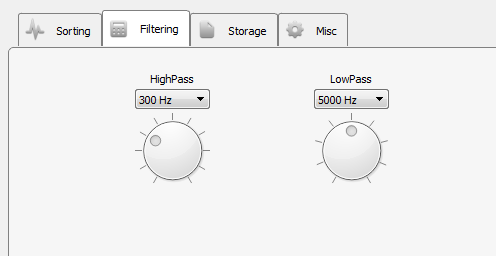 |
| Filtering Options Tab |
Storage Tab
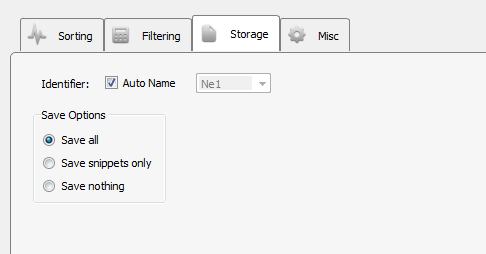 |
| Storage Options Tab |
Select whether to save only snippet waveforms or to include the plot decimated waveforms used by the sorting gizmo, or to save nothing at all. The waveforms will still be displayed in the runtime interface and data plots but will not be saved to disk.
Misc Tab
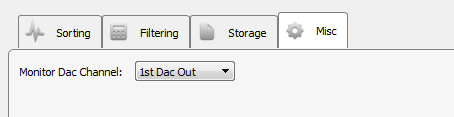 |
| Misc Options Tab |
Monitor DAC Channel
Select an output channel to send the monitor signal to, or set to Disable to turn monitoring off.