Oscilloscope
Common Use Cases

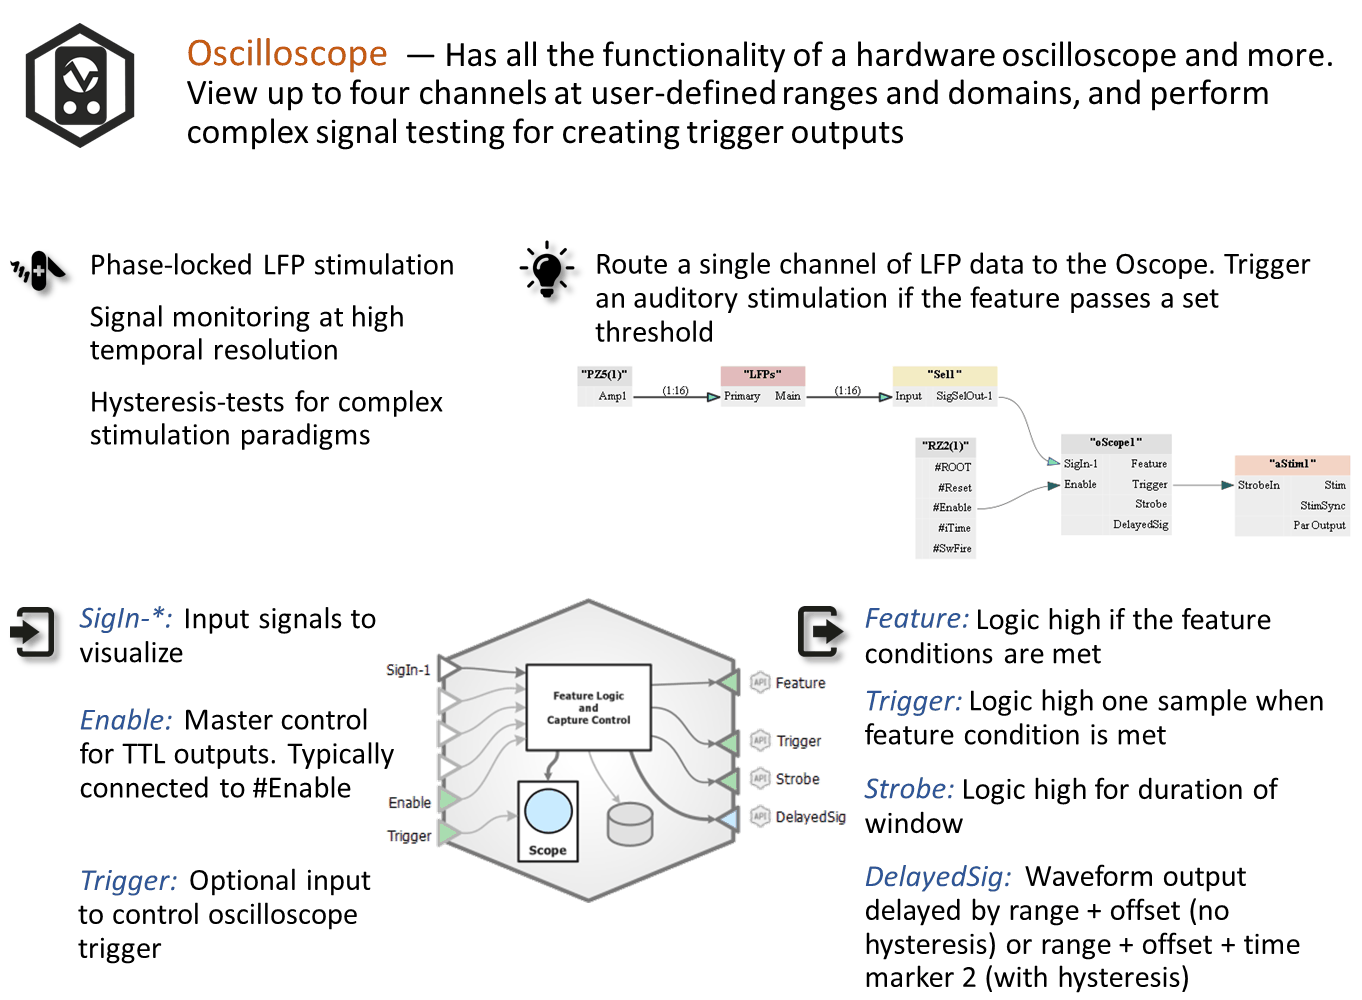
Has all the functionality of a hardware oscilloscope and more. View up to four channels at user-defined ranges and domains, and perform complex signal testing for creating trigger outputs. Use this gizmo to visualize signals on a more refined time scale, or to perform thresholding or hysteresis tests for complex triggering paradigms like phase-locked stimulation off LFPs.
Gizmo Help Slides
Reference
The virtual oscilloscope gizmo has all the functions of an oscilloscope plus flexible trigger design tools for triggering, using more complex waveforms. Triggering is implemented on the hardware and in real-time. The gizmo's user interface provides a view into what's happening and includes controls for adjusting the signal feature threshold(s). The oscilloscope works well for simple threshold and store tasks and is an excellent tool for closed loop triggering.
The gizmo supports up to four channels of input and includes several outbound logic signals, a waveform output, and an internal data store as shown above.
The Runtime Interface
Runtime Plot
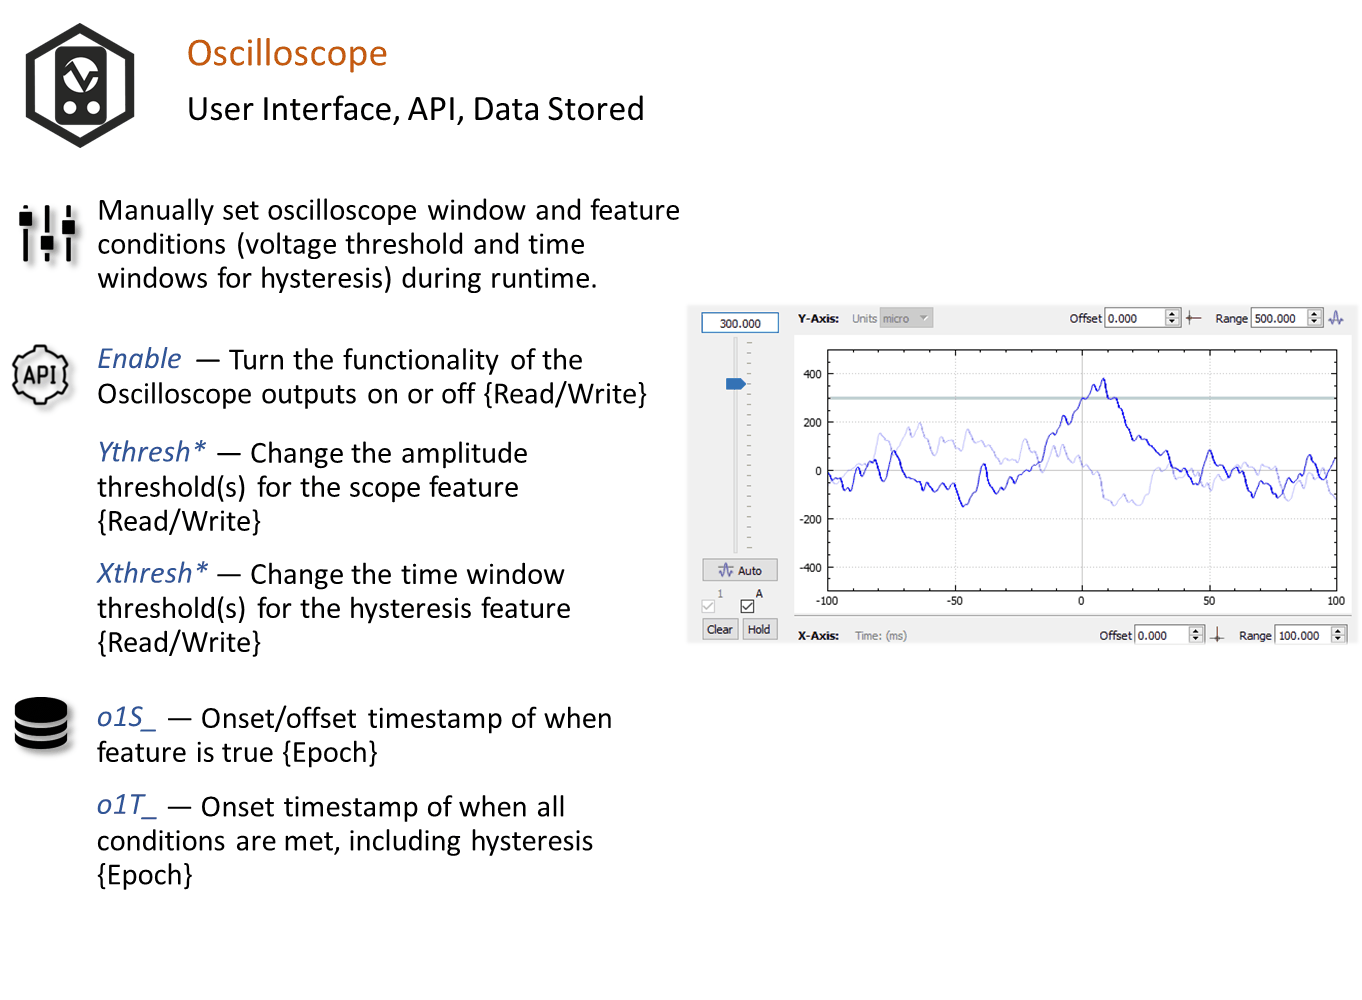
At runtime, the standard Synapse data plot is available to display any stored data. The gizmo can save epoch events when the selected feature is true and/or when the required condition passes. A snippet waveform capturing the oscilloscope plot window to disk can also be saved when triggered. These stores are selected in the oscilloscope configuration options.
Oscilloscope Plot
The runtime oscilloscope plot must be configured in the Edit mode options before it can be used. Its use and features are nearly identical to the preview plot available in Edit mode. It allows you to modify or lock threshold, range, and offset at runtime.
Important
Oscilloscope is unique in that the runtime changes also modify the experiment setup. Any changes you make to the plot configuration at runtime are saved with the experiment design and vice versa. This goes against the typical Persistence model in Synapse where runtime settings are seperate from designtime settings. This helps you 'set up' the plot you want in the experiment settings using real data in a runtime mode.
Oscilloscope Configuration Options
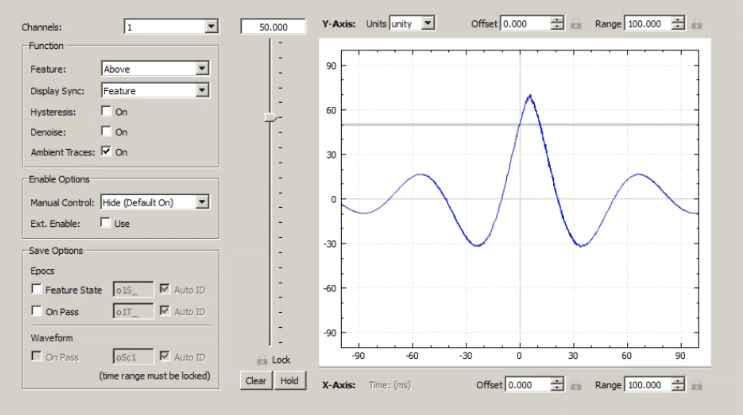
In edit mode, the oscilloscope gizmo displays a simulated waveform alongside the gizmo options. This interface expedites setting the feature and triggering options.
 |
| Oscilloscope Options Area |
Channels
Input up to four single channels. Only one channel can be used for feature detection at a time, but when conditions are met, all channels get stored (when Waveform is selected).
Function
Feature
A standard threshold detection method is used to determine when a signal of interest is present. By default, the Feature is Above, and the image is synced to the feature state, just like an oscilloscope. That is, the threshold crossing is set as X=0 and the X and Y axes are set to the defined range.
Display Sync
Determines how to align the waveform at x = 0.
Hysteresis
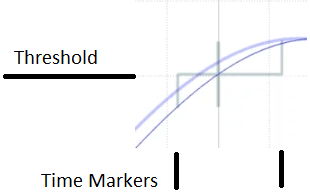
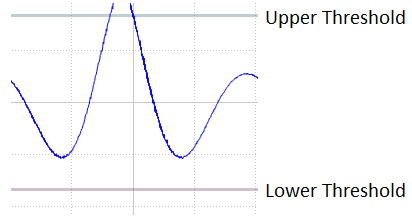
To add temporal characteristics to feature detection, enable Hysteresis. The hysteresis marker replaces the default threshold marker. Two time markers are added on the x-axis and are controlled by sliders.
In the illustration at right, the feature condition must be false for the time period between Time Marker 1 and the threshold crossing, and must be true between the threshold crossing and Time Marker 2 to pass all conditions. If it passes, the Trigger output pulses high for one sample. If it does not pass, the candidate waveform is displayed as a thick light blue line.
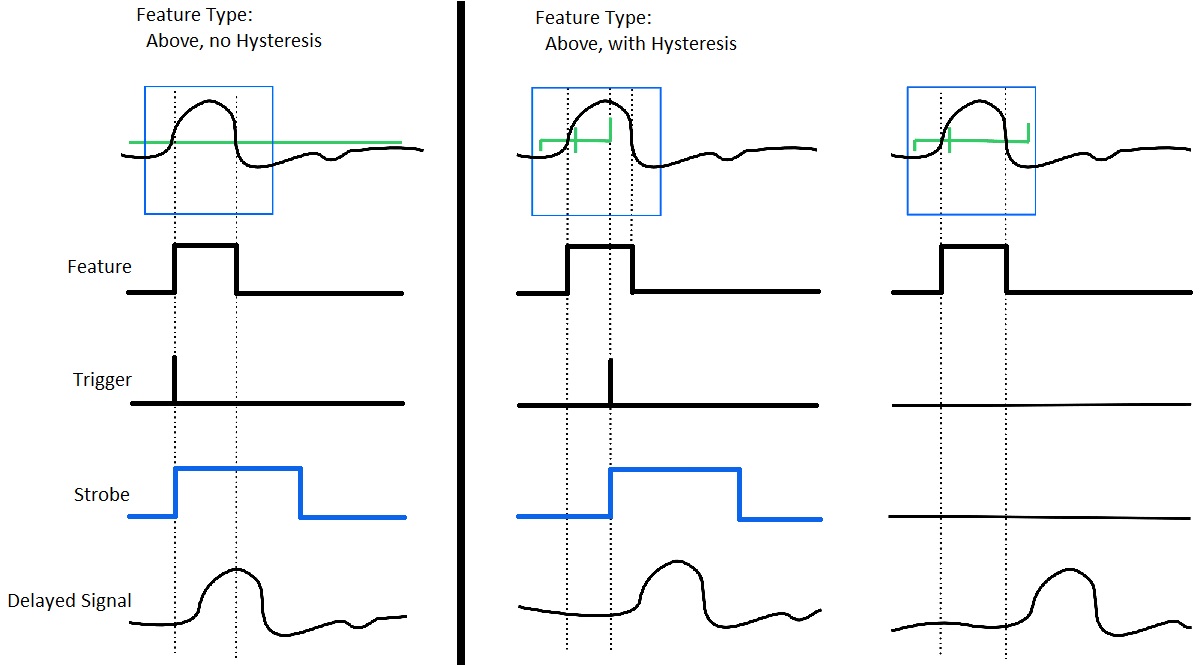
As shown in the diagram above, when Hysteresis is used, the signal must meet all conditions or no trigger is fired.
The Delayed Signal output is shown at the bottom. When there is no Hysteresis, this signal is delayed by range + offset, so you are always looking at the waveform window when the Strobe is high. When you do use a hysteresis, the delay is the range + offset + time marker 2.
Denoise adds a fixed three sample debounce to prevent spurious feature detections in a noisy signal. The feature must be true for 3 samples to register as a valid event.
Ambient Traces option show all traces even the ones that don't meet feature conditions. They are shown as thinner lines. If you don't have any signals meeting the feature conditions, viewing ambient traces can show where you need to set the threshold.
Enable Options determine the state of the manual controls at runtime. When the controls are on an Enable button is added to the runtime window. When present, it must be selected to enable the Trigger and Strobe outputs.
When the option is set to hide (default on), the Trigger and Strobe outputs are enabled (On), but the button is hidden. For more on the Strobe and Delayed Signal outputs see "Storing Outputs" below.
Save Options
Epocs
-
Feature State stores the Feature state on/off timestamps. Feature state remains true/high (1) as long as the Feature condition is met.
-
On Pass stores the Trigger timestamp. Trigger fires once when all conditions are met, including any hysteresis.
-
Waveform On Pass store the plot snippet when feature conditions are met.
Storing Outputs
You can also pass the oscilloscope outputs (seen in the block diagram) to storage gizmos.
If you wanted to save the waveform on pass, but didn't want to use a fixed x-axis window (range), you can send the Strobe and DelayedSig output to a Strobe store gizmo.
-
Strobe starts when Trigger fires (all conditions are met) and remains high for the duration of the X-axis window (range).
-
DelayedSig is a continuous waveform delayed by the X-axis range and offset, such that you can always store what you are seeing in the plot.
Preview Plot Options
The plot area includes intuitive controls and provides immediate visualization of your changes. Drag the threshold marker along the slider to set a threshold.
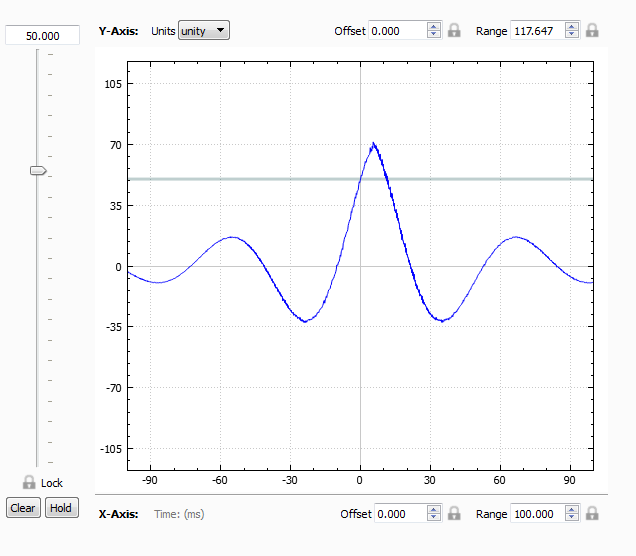 |
| Single Channel Preview Plot |
Using Multiple Channels
When you use multiple channels, you can select which channel is used for detection by selecting from the drop-down menu located above the threshold slider. You can also choose which channels to display in the plot, using the channel number check boxes below the threshold slider.
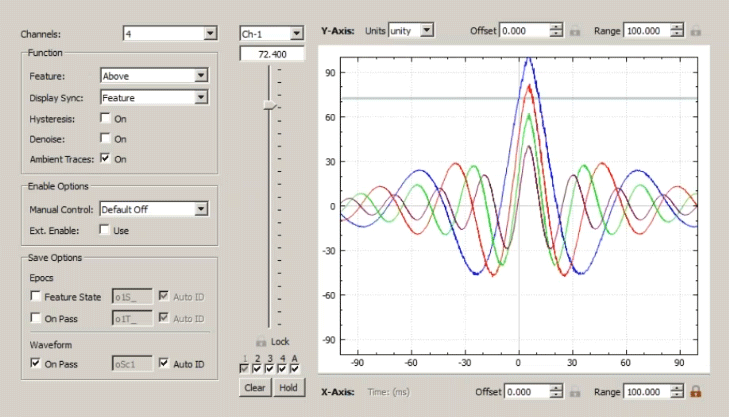 |
| Multi-channel Preview Plot |
Check boxes for each channel are shown below the threshold slider. The grayed check box is the currently selected channel. Select additional numbered check boxes to show those channels in the plot.
Plot Controls