Signal Accumulator
Common Use Cases

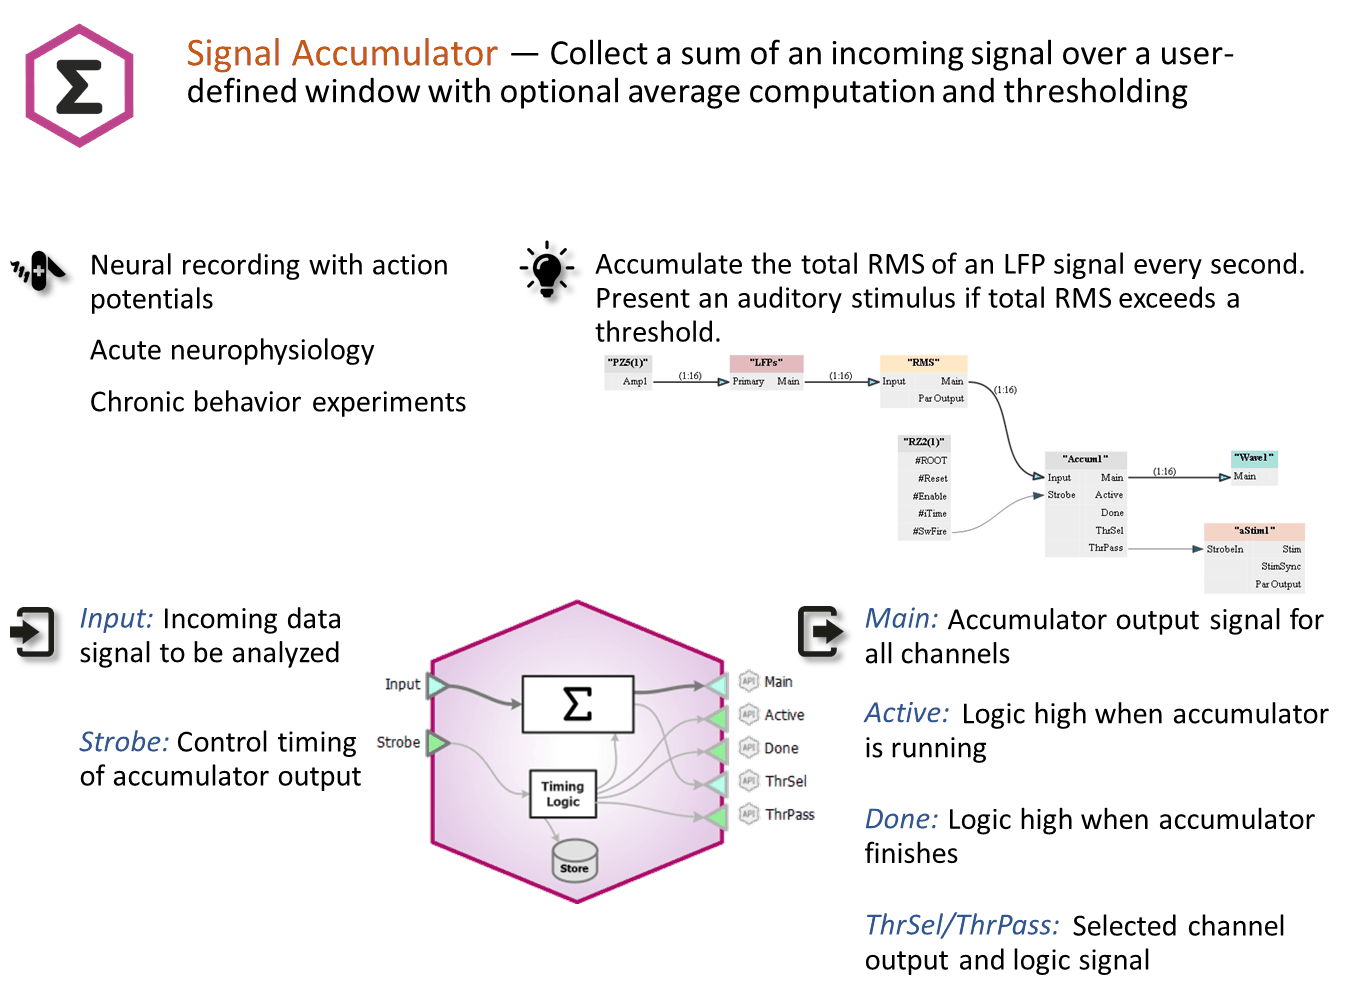
Collect a sum of an incoming signal over a user-defined window. Optionally compute the average as well. Can also perform thresholding of accumulated signal for further processing. Use this gizmo to calculate the total power of a signal over a specified time span, or to compute average signal power over many trials.
Gizmo Help Slides
Reference
The Runtime Interface
Runtime Plot
Scalar and epoch plots, if enabled, are added to the runtime window for visualization when enabled in the gizmo options. See Flow Plot for more information on using and customizing the plots.
Signal Accumulator Plot
The runtime Signal Accumulator plot must be configured in the Edit mode options before it can be used. See See Plot Preview Tab. for more information.
Important
Accumulator is unique in that the runtime changes also modify the experiment setup. Any changes you make to the plot configuration at runtime are saved with the experiment design and vice versa. This goes against the typical Persistence model in Synapse where runtime settings are seperate from designtime settings. This helps you 'set up' the plot you want in the experiment settings using real data in a runtime mode.
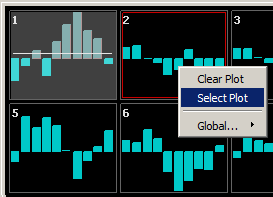
Use the right-click menu to choose which channel is actively used with the threshold detector.
Once the desired plot is selected, if the threshold is not visible then right- click and select Find Threshold.
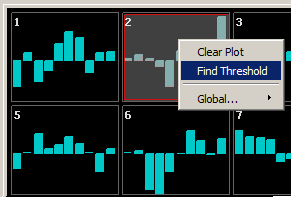
Once the threshold is visible, use the left mouse button to click-drag the threshold bar into place.
Signal Accumulator Configuration Options
General Tab
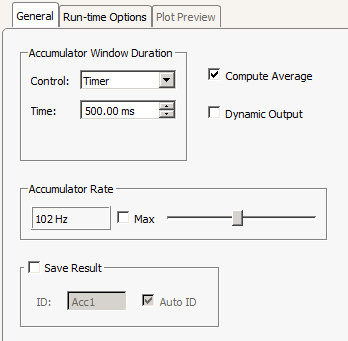 |
| General Tab |
The Accumulator samples at the Accumulator Rate. The start and end of the accumulation period is controlled by the Accumulator Window Duration. The different control methods for controlling the window duration are shown below. The accumulator output is ready when the Done signal goes high.
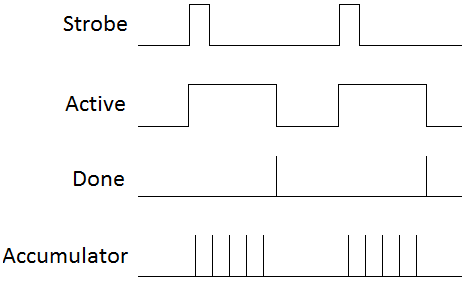 |
| Timer Control Mode |
In Timer mode, the accumulator runs for a fixed duration when the Strobe input signal goes high.
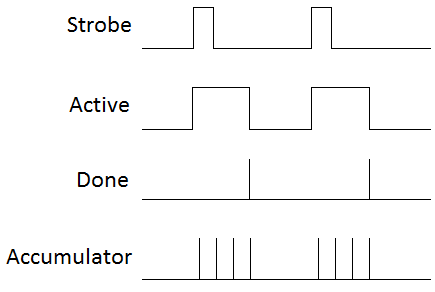 |
| Counter Control Mode |
In Counter mode, the accumulator runs for a fixed number of ticks of the accumulator clock. In the above example, the Count is set to 4.
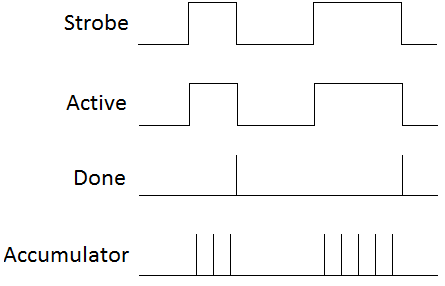 |
| Strobe Input Control Mode |
In Strobe Input mode, the accumulator start and stop times are determined exclusively by the Strobe gizmo input, which can be variable durations.
When Compute Average is checked, the sum over the accumulation window is divided by the number of accumulation samples to get the signal average.
The gizmo Main and ThrSel outputs latch when the Done signal goes high. When Dynamic Output is enabled, the Main and ThrSel outputs also update on each tick of the accumulator clock with the current values in the accumulator.
Run-time Options
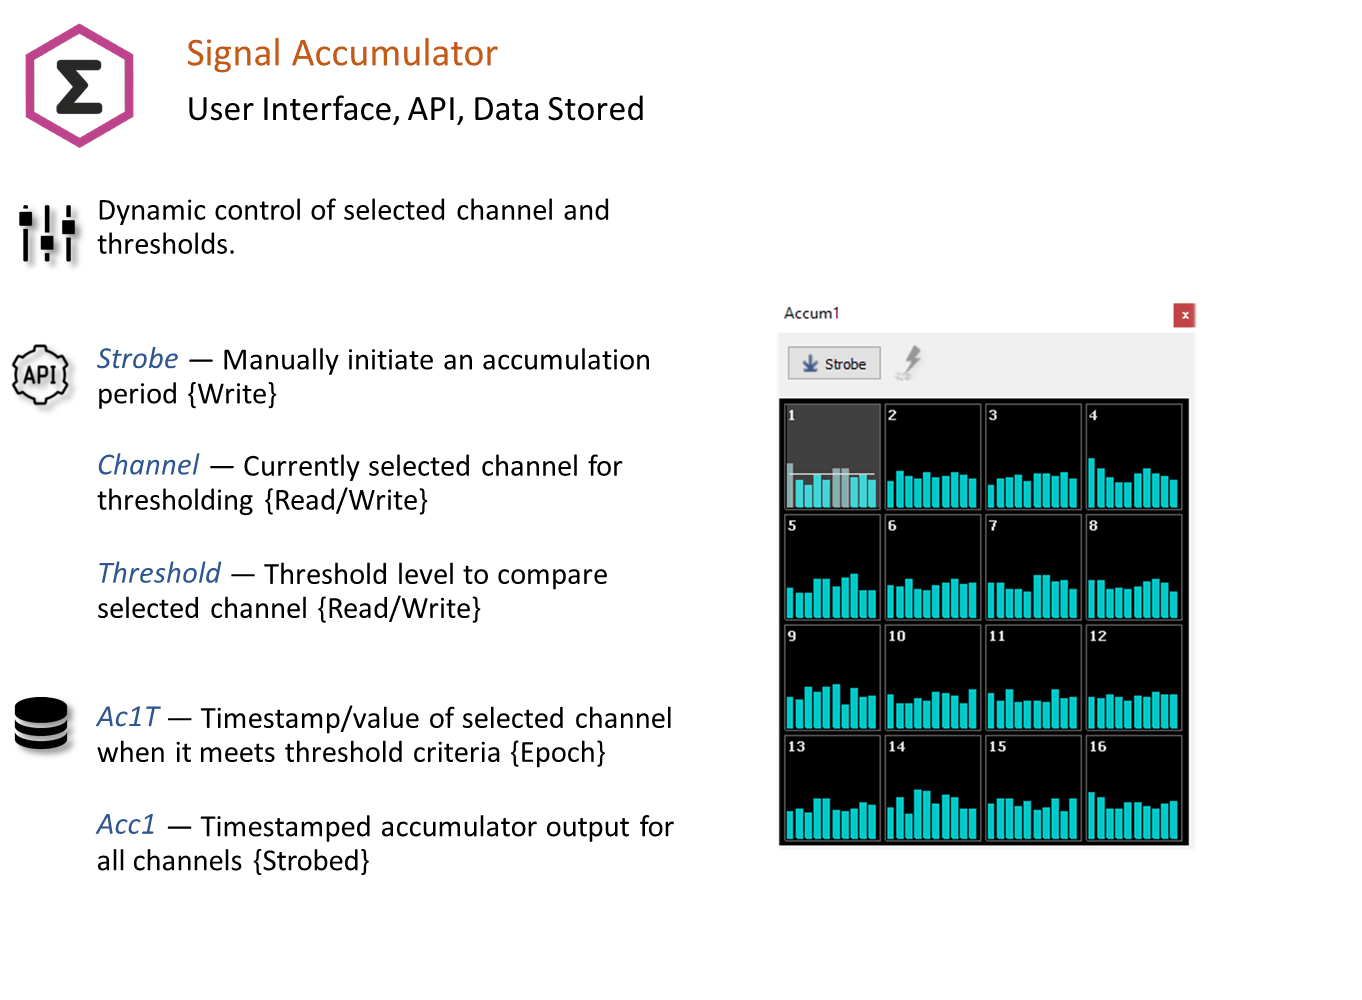
The Signal Accumulator has an optional run-time interface that shows a bar graph of the accumulator results. You can optionally set a threshold on this plot to convert this value into a logic signal for decision making. This threshold crossing drives the ThrPass gizmo output.
An optional Mute Control allows the user to dynamically disable the ThrPass output at run-time.
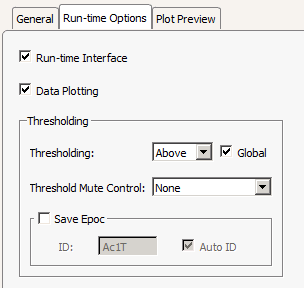 |
| Run-time Options Tab |
If Global Thresholding is selected then any changes to the threshold at run-time apply to all channel thresholds.
Plot Preview Tab
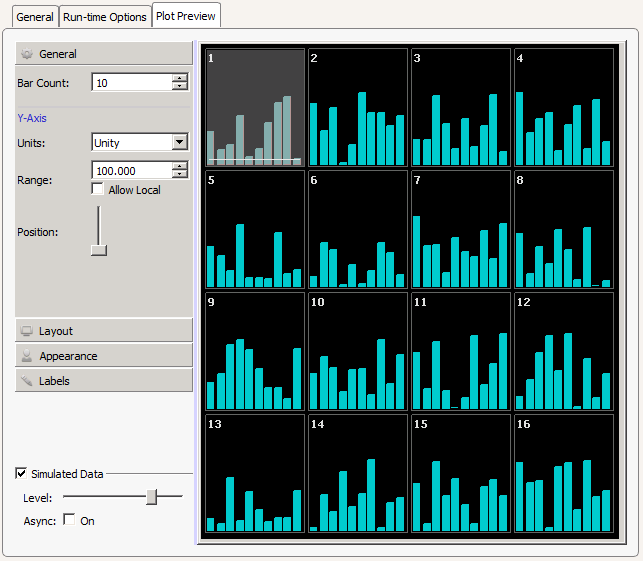 |
| Plot Preview Tab |
If Allow Local is selected, Ctrl + left-click-drag will change the range of the individual plot and Shift + left-click-drag will adjust the range of all plots.
Note that only the Y-axis range (Shift + left-click-drag or mouse wheel) and offset (Alt + left-click-drag) are adjustable at run-time, as well as the threshold (if enabled). All other visualization settings are adjusted at design- time in the Plot Preview tab.
Important
Accumulator is unique in that the runtime changes modify the experiment setup. Any changes you make to the plot configuration at runtime are available at designtime and vice versa.