IZ2 Electrical Stimulation
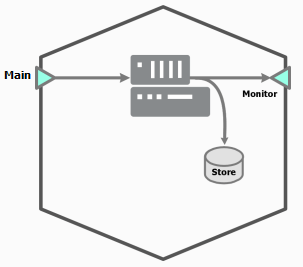 |
| IZ2 Block Diagram |
The IZ2 requires a multi-channel floating point data source.
IZ2 Options
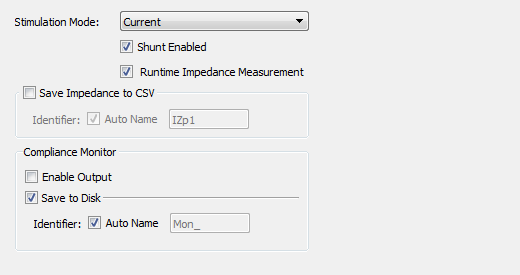 |
| IZ2 Options |
See the Stimulus Isolator section of the System 3 Manual for more information about stimulator operations.
Runtime Interface
When Runtime Impedance Measurement is checked, a user interface appears at runtime.
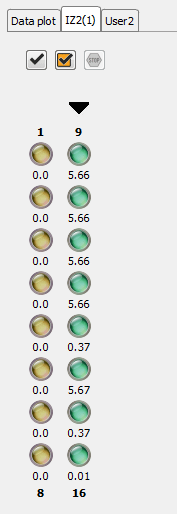
The IZ2 tab provides an interface for impedance checking on all channels. The display represents the stimulation channels divided into banks of eight channels. Channel numbers are labeled above and below the bank column in the diagram. The currently selected bank is indicated by a black arrow above it. This is also the bank that is actively monitored in the Compliance Monitor. To change the selected bank, click any LED in the desired bank.
Defining the Probe and Target
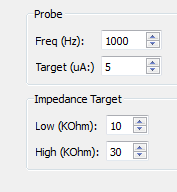
In the area beneath the probe diagram, you can set test signal frequency and amplitude, and define the high and low impedance threshold targets for visualization.
Running the Check

Run an impedance check on the currently selected bank. The test signal (sine wave of frequency defined by Freq (Hz) parameter and amplitude defined by Target (uA) parameter) is presented iteratively on each channel in the currently selected bank for 500 ms and the impedance is measured.

Check All. Run an impedance check for all channels by cycling through each bank of eight channels using the test signal as described above.

Stop Checking. Stops the impedance checking prematurely.
Results of impedance check are indicated by color: below low impedance threshold (green), above high impedance threshold (red), between low and high impedance thresholds (yellow). The actual impedance values (in KOhm) are displayed beneath each indicator.