Launching Your First Experiment
The quickest way to start collecting data with Synapse is to use a template. After initial system set-up, you can use these ready-to-go experiments to collect data on day one or use them as a starting point for a more customized experiment. This section covers:
- Editing your Rig
- Creating an Experiment from a Template
- Using the Runtime Interface
Editing the Rig
Before you can run an experiment you must allow Synapse to gather information about the System 3 hardware components in your system. TDT processors come in many configurations that have different capabilities. Once Synapse knows which devices you're using, it will keep track of the device details for you.
Important
In Synapse, your hardware system is referred to as the 'rig' and it is remembered each time you open the software. The first time you launch the software, the Rig Editor is displayed automatically. You only need to edit the rig if your physical hardware configuration changes.
Configuring the rig starts with letting Synapse detect your system devices. Make sure your TDT hardware is set-up, connected, and powered on before using the Detect button to begin configuring the rig.
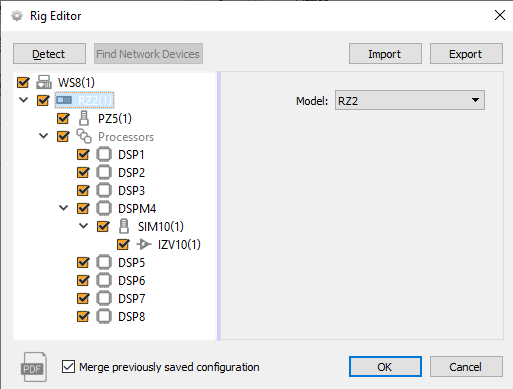 |
| Rig Editor: RZ2 Selected |
Click on a detected device to show configuration settings.
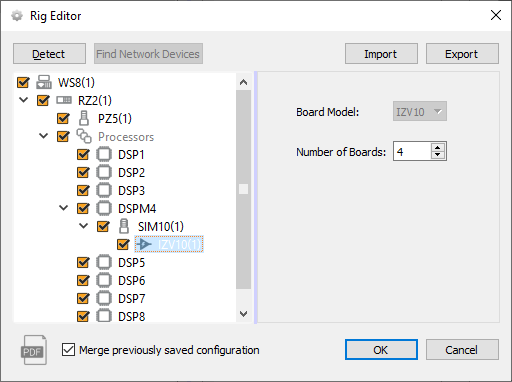 |
| Rig Editor: SIM IZV Selected |
Important
There are some devices or configuration settings that Synapse can't automatically detect. For example, IZ2 stimulators don't report their channel count. So you might see an IZ2 in the tree, but it defaults to an IZ2-32. Double-check the peripheral devices in the tree and verify they match your physical hardware.
You can enable or disable devices to control whether they are automatically added to the Processing Tree in new experiments. For example, if you aren't using electrical stimulation on most experiments then you might want to disable the checkbox. Disabled devices can still be added later and enabled manually in the Processing Tree. See Disabled Devices and the Processing Tree for more information.
Adding a Device
The UDP interface, a USB Camera, and RA (Medusa) amplifiers are examples of devices that might be part of your system, but can't be detected by Synapse. These devices can be added to the rig manually using the RZ shortcut menu. Right-click your system's processor device (such as RZ2 or RX8) and select the device from the menu.
Similarly, if you have an optical quad DSP (DSPQ) with a peripheral device connected to it, such as a Subject Interface, Synapse doesn't know which device it is. Right-click on the DSPQ in the rig and add the device you have connected to that DSP.
After the rig is initially configured, you won't need to repeat this process in future sessions unless your hardware changes. If you do need to make changes, you can return to the Rig Editor, using the Edit Rig command in the main menu.
For more information on working with the rig, see The Rig.
Creating an Experiment from a Template
Templates are pre-built experiments created by TDT to speed up experiment creation. Each Synapse template is a basic working experiment that can be run as configured or modified to meet your needs.
You can access any saved experiments by clicking the Experiment button on the command bar, then clicking More. Templates are stored in special category folders within the Templates folder.
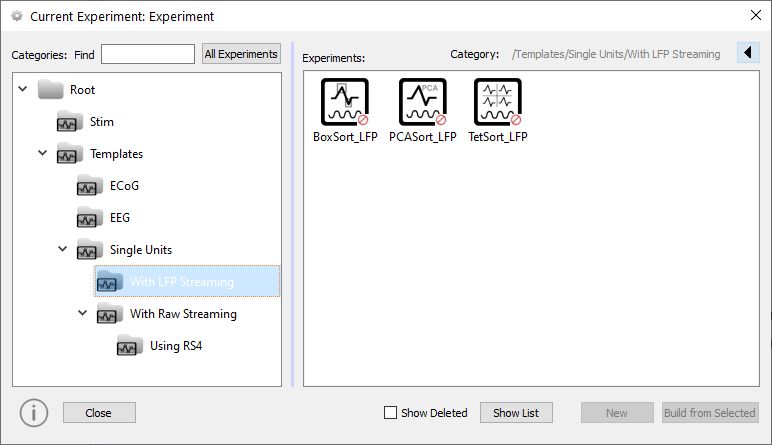 |
| Current Experiment Window |
The Current Experiment or Experiment Selection window is similar to a standard Windows Explorer window with folders, or categories, on the left and experiments in the category on the right.
The rest of this section will take a look at the following template:
Templates | Single Units | With LFP Streaming | PCAsort_LFP
Template files are locked to ensure you will always have an unaltered set in their original state. Select the desired experiment template and click the Build From Selected button, to create an editable copy.
The Rig and the HAL
Synapse has two ways of remembering information about your hardware.
The Rig HAL
The Rig Hardware Abstraction Layer (HAL) is the collection of hardware information that stays with your copy of Synapse. It is used to execute your experiments.
The Experiment HAL
The Experiment Hardware Abstraction Layer (HAL) is a collection of hardware information that is stored with the experiment. It remembers the hardware used to create the experiment.
Each template contains HAL information about the system used to design it. When the template is launched, Synapse tries to adapt it to run on your rig. If it is unable to do so, alert symbols are added to the problem elements in the Processing Tree.
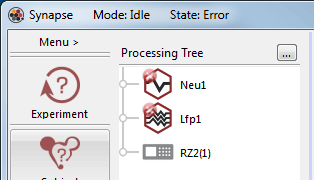 |
| Processing Tree with Error Alerts |
In the illustration above, the necessary PZn wasn't enabled in the rig where the template was opened. The problem is easily corrected by enabling the PZn.
Viewing the New Experiment
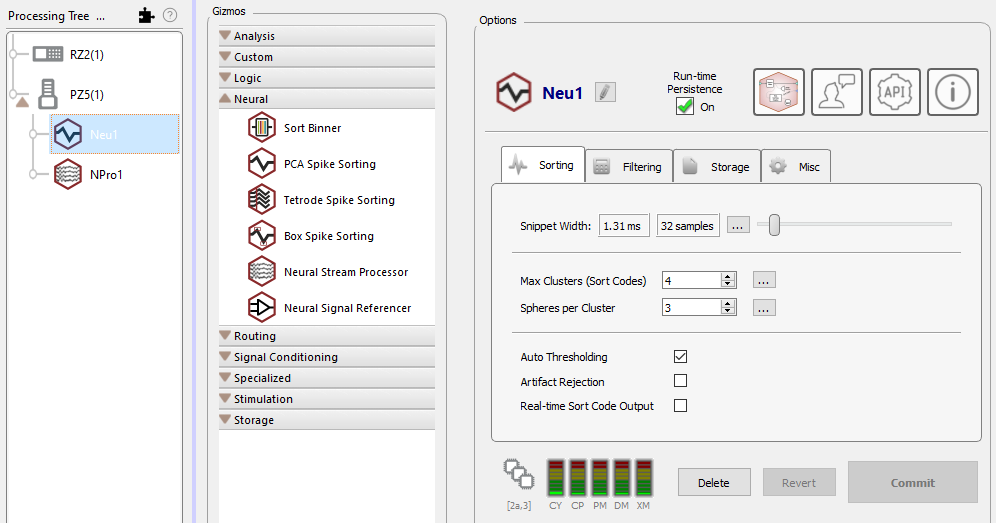 |
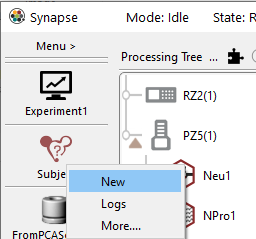
| PCA Spike Sorting Gizmo Options in Synapse Window |
In the new experiment, two task blocks called 'gizmos' are added to the Processing Tree beneath the PZ amplifier: one for LFP filtering (NPro1) and another for PCA spike sorting (Neu1). The Processing Tree represents the path of data flow and in the example above the hierarchy shows that the LFPs and Single Units are being acquired in parallel from the same signal source (PZ5). When a gizmo is selected in the tree, its configuration options are displayed in the Options area to the far right. For information on modifying gizmo options, see the corresponding reference in the Gizmo Reference.
Naming the Experiment
Before you name the experiment, take a quick look at the Synapse interface.
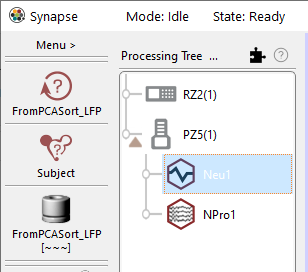 |
| Synapse Designtime Interface |
Notice the large buttons at the top of the command bar, seen on the left side in the illustration above. The buttons that are initially displayed in red and are switched to black as each area is configured. Until configuration is complete the experiment Record button is unavailable.
Before you can begin collecting data, the new experiment needs to be named and
saved. Click the Experiment (From PCASort LFP) button and click Save as.
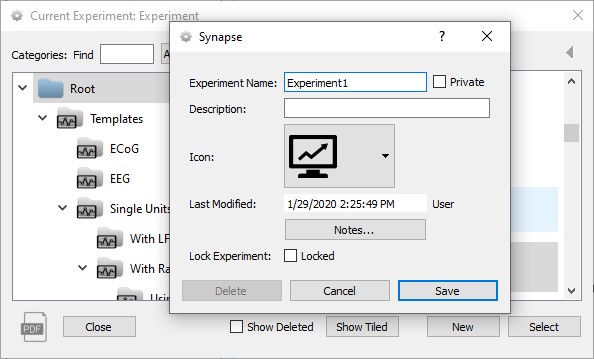 |
| Current Experiment Window and New Experiment Dialog |
In the dialog box you can enter an experiment name, description, or add notes. The experiment is saved under the Root directory. You can add and move categories and experiments using right-click menus.
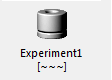
When you return to the main designtime interface, the experiment has been saved,
a new tank name is displayed under the tank icon, and the Record button is
available.
The experiment name is one of three special categories of information that Synapse tags and uses in its relational database to index and track designtime and runtime settings and any modification made to parameters during each experiment run. The other two categories are users and subjects. Which of these buttons is displayed is controlled by Synapse preferences. In the default configuration only the experiment and subject are displayed and both must be configured before recording.
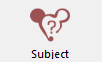
To add a subject, click the Subject button in the command bar, then click New.
 |
| Subject Menu |
You'll need to enter a name in the Subject Name field. You can also enter a description, password, or notes and choose an icon. When you're done adding information, click Save.
The steps to add users and subjects are much the same. For more information about the user, subject, and experiment features, see Managing Users and Subjects.
Using the Runtime Interface
When an experiment is fully configured and saved, the Preview and Record buttons are enabled. In preview mode you can display data, adjust plots, and change runtime settings without any of the data being permanently stored to the data tank. This is particularly useful for tasks like spike sorting, where you might want to establish the sorting parameters before collecting data. For more straightforward tasks, like recording streamed data, you might choose to skip preview and go straight to record mode.
Mode Buttons
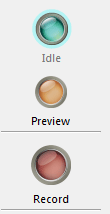
The Runtime Window
The runtime window includes tabs with the main data plot and runtime controls for each gizmo. The data displayed is pulled directly from the hardware and sent to the display in parallel with data storage.
The Flow Plot includes a plot for each type of data being stored. Each plot is automatically configured according to the type of data, for example: snippet, streamed waveforms, or epoch events. You might need to scale the plots to display the waveforms appropriately. This window is explained in more detail in Runtime.
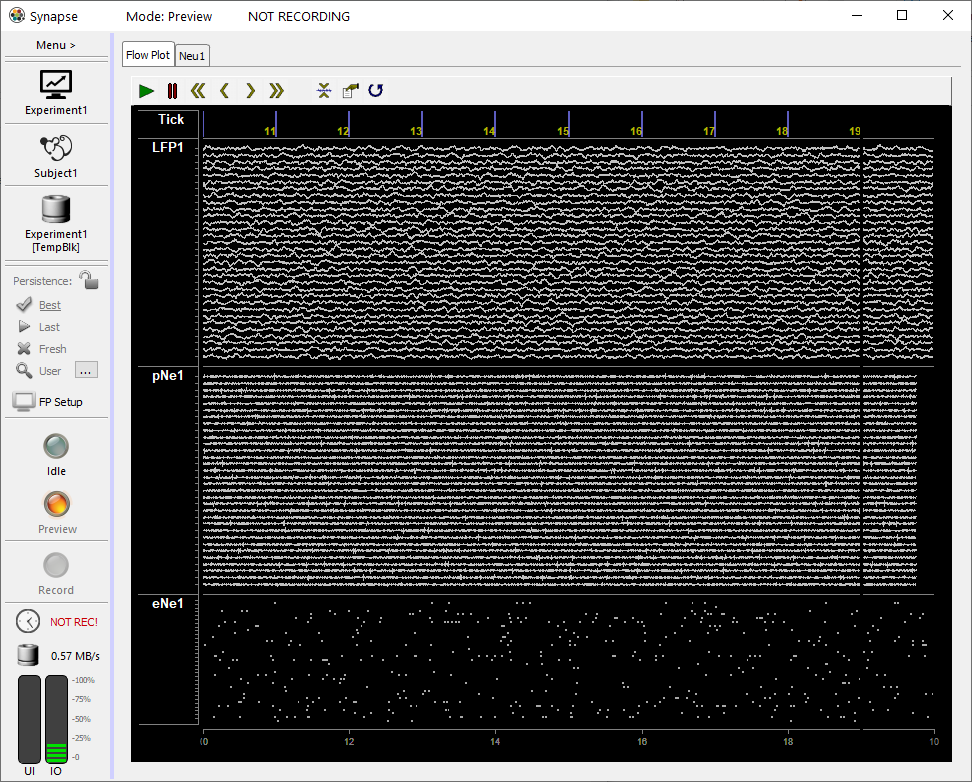 |
| Main Plot at Runtime - Streamed LFPs, Plot Decimated Waveforms, and Snippets |
The second tab in the template is from the PCA Spike Sorting gizmo and is an interactive display with plots for cluster cutting and provides runtime access to many of the configuration setting, such as filter values, display options and even the sorting algorithm. You can find more information on this interface in PCA Spike Sorting.
To make sure you don't lose your cluster definitions and other settings between runs, Synapse will remember them according to your persistence setting.
Persistence
By default, Synapse saves the state of all experiment variables, including filter settings, threshold values, and cluster definitions in its relational database during each recording session. Any change made to a setting is logged in the database with the current subject and experiment. This database supports several useful features including persistence and history browsing, filtering, and export features.
In the runtime window, 'persistence' refers specifically to how past experiment states are applied the next time the experiment is run. You can choose this behavior using the Persistence choices on the command bar.
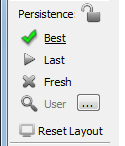
Unless you lock the choice, persistence returns to the Best default behavior after each recording session.
History
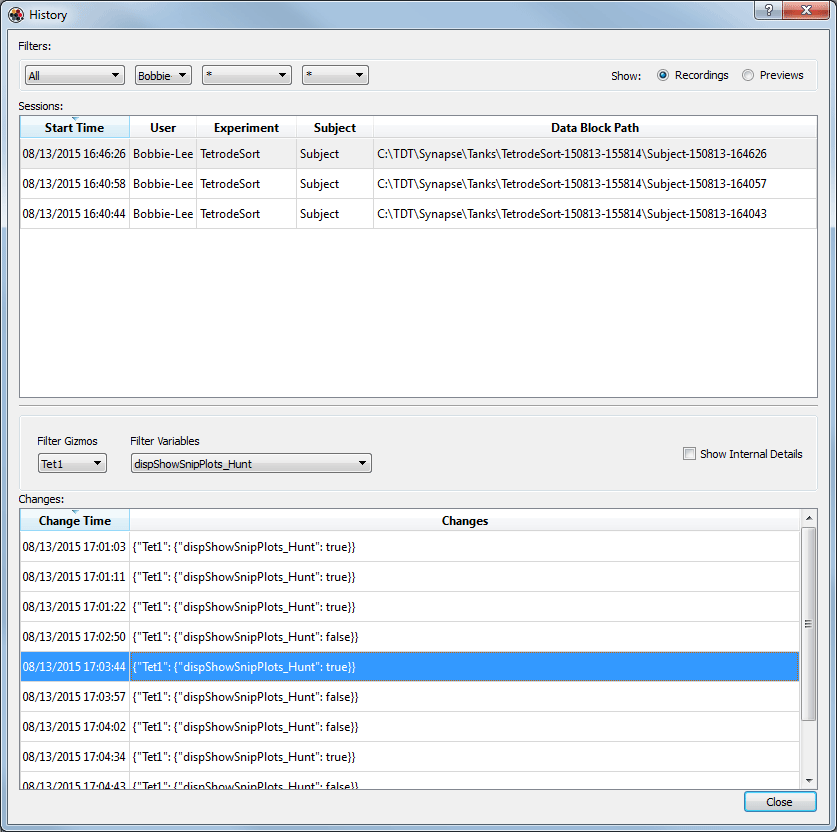 |
| History Window |
This window includes a variety of filtering mechanisms to help you quickly find the data, experiment state, or specific setting value you are looking for. Using shortcut (right-click) menus you can select and return to start and end states for each session or any change state during the session. The top section of the window also displays the path and location for the data recorded during that session. You can begin working with the data set immediately from this window, using the same shortcut (right-click) menus.
Window Layout
Synapse can also remember information about tab layout. You can drag tabs to float them in new windows or right-click the tab to control placement inside the main window. Information about the window layout is specific to the user and is separate from persistence information. In Idle mode, you can setup the layout using the RT Layout button on the command bar.
The Data Tank
TDT's TTank data server indexes and stores recorded data then makes the data available for post hoc visualization and analysis. By default, Synapse names data tanks (a grouping of recordings) automatically based on the experiment's name. Blocks (single recordings) are automatically named based on the subject ID for that recording session. These default preferences are ideal for labs that run an experiment on multiple subjects then move on to another experiment. If your lab does things differently, such as running experiments on the same subject to compare results over time you can change the Synapse preferences to organize the data is different ways. For more information, see Managing Data for Your Lab.