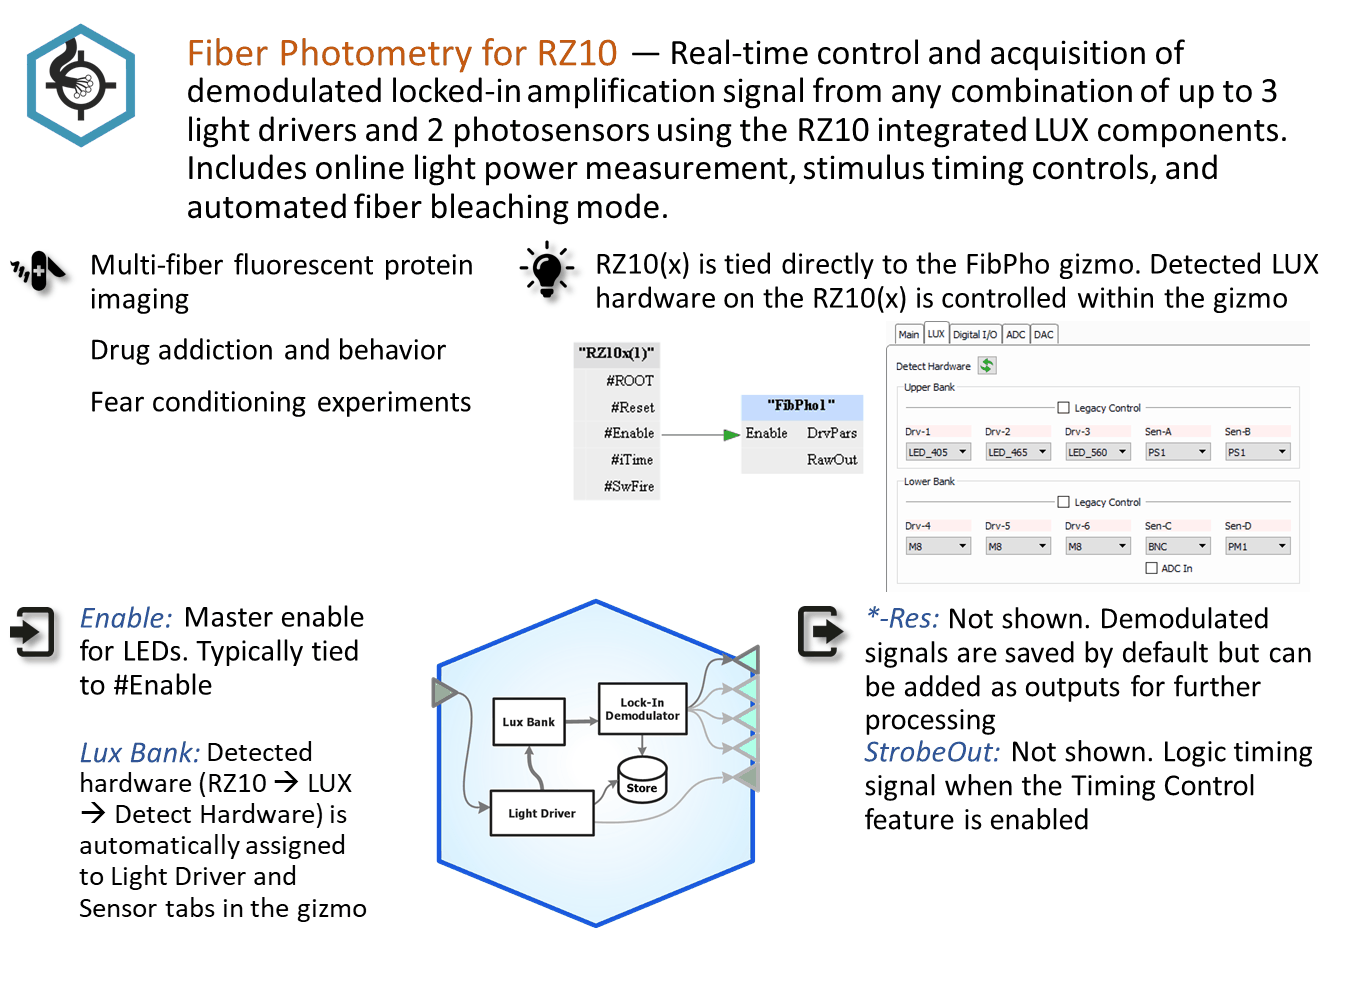
Fiber Photometry for RZ10x Processor
Common Use Cases
Real-time control and acquisition of demodulated locked-in amplification signal from any
combination of up to 3 light drivers and 2 photosensors on a Lux bank.
Can also monitor light power from PM1 from any Lux bank. This is the primary gizmo
used in fiber photometry setups using RZ10x processors. Record up to 6 demodulated
signals with raw photosensor output and dF/F calculations, too.
| Data Stored |
|
| Stream |
Raw sensor and demodulated response signals |
| Stream (optional) |
Broadband raw signals |
| Scaler (optional) |
Driver parameters |
| Outputs |
|
| Calculated signals (optional) |
Up to 4 single-channel floats |
| Timer signal (optional) |
Logic signal when LEDs are enabled |
Gizmo Help Slides
Reference
The Fiber Photometry gizmo includes designtime and runtime control for the RZ10x
LuxIO processor built-in LED light drivers. It uses lock-in amplification to
measure the real-time power of the resulting fluorescence response at the LED
driving frequencies.
It provides an estimate of the LED power output and can also measure power at
the subject end. It has a built-in timer for timed stimulus control and
automatic photo-bleaching capabilities.
Each Fiber Photometry gizmo targets a single LUX bank of components on the RZ10x,
controlling up to three LED drivers and reading two photosensors. PM1 power
meters are handled uniquely; they can be accessed from any LUX bank.
The Runtime Interface
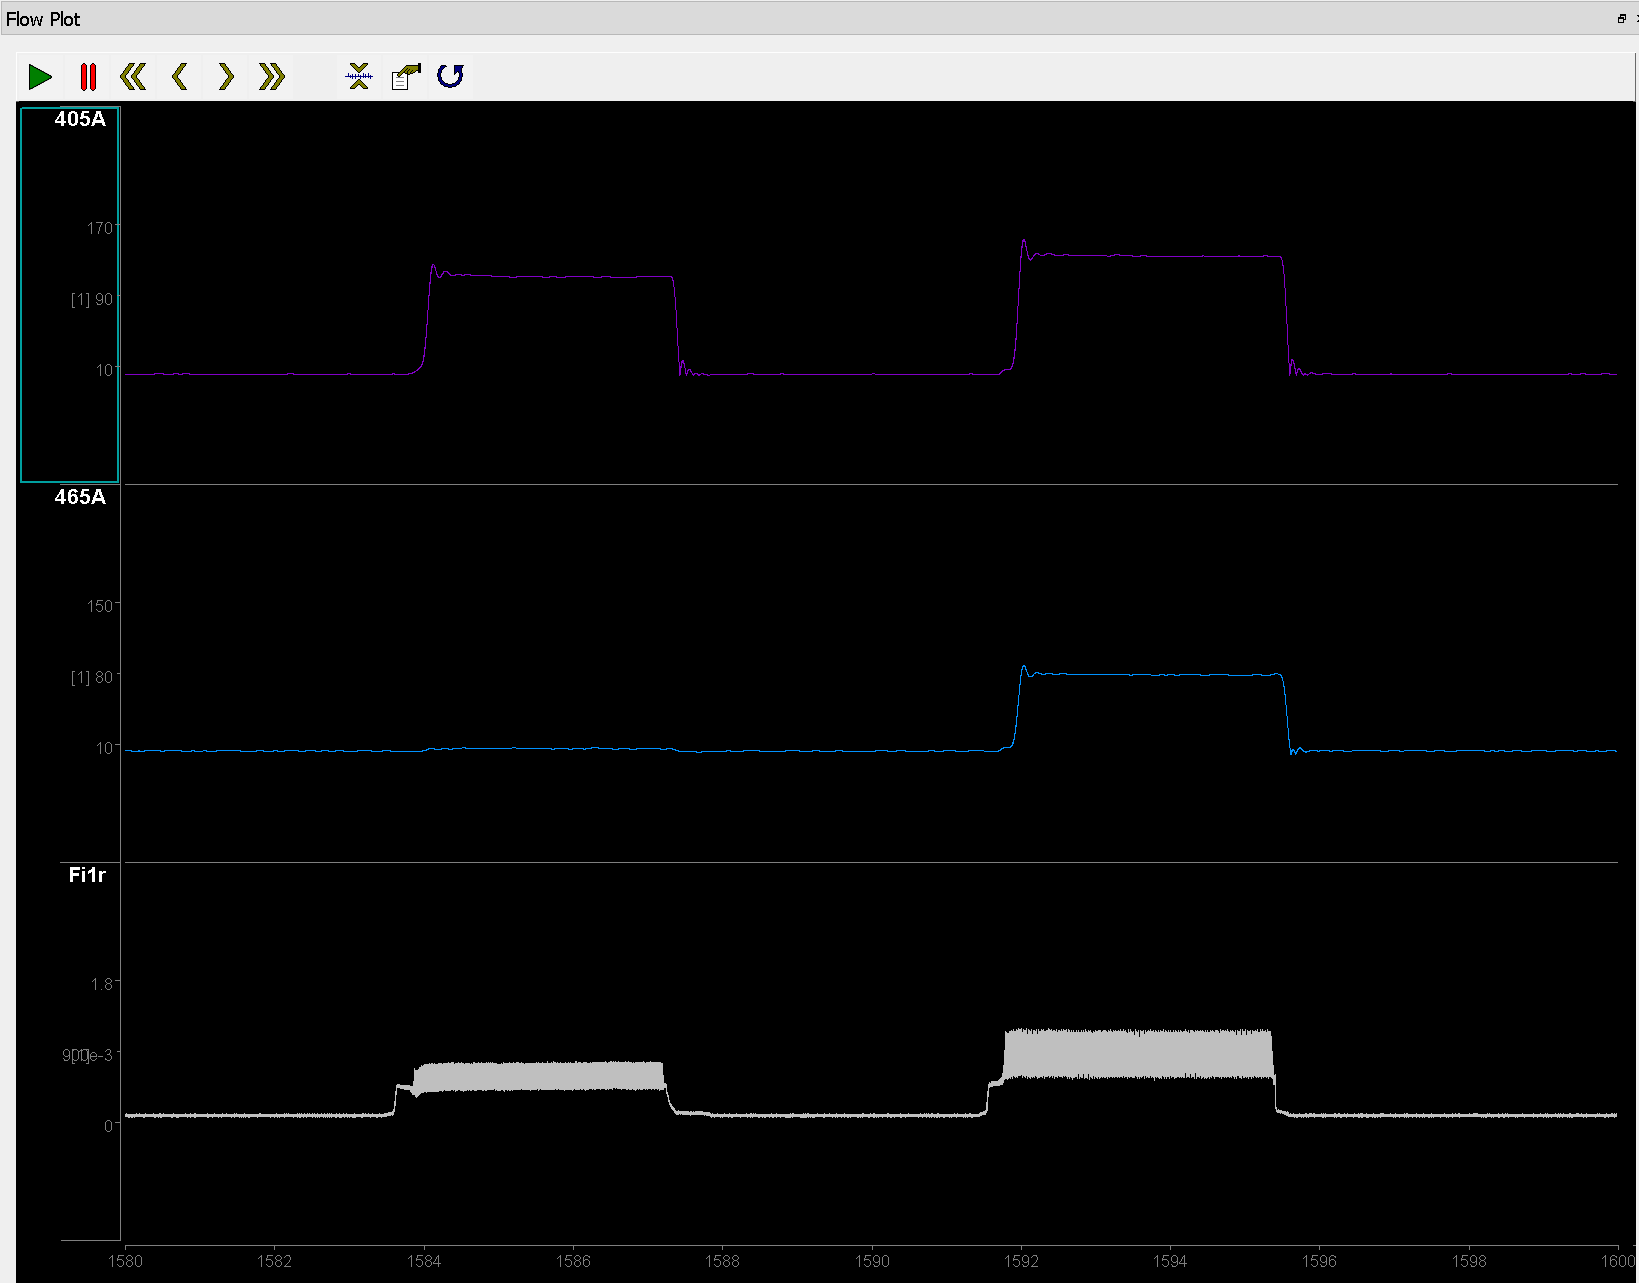
Runtime Plot
A plot is added to the runtime window for visualization.
 |
|
Flow Plot Showing Demodulated Responses |
The subplots shown in a runtime plot represent data storage you chose in the
designtime options. In the example above, the streamed data shows the resulting
power output (405A, 465A) at the frequencies of the 405 and 465 driver signals
on the sensor A input. The Fiber Photometry gizmo also stores and displays
broadband raw input signals and driver parameters, depending on selections made
at designtime. Fi1r is the raw sensor input in this example.
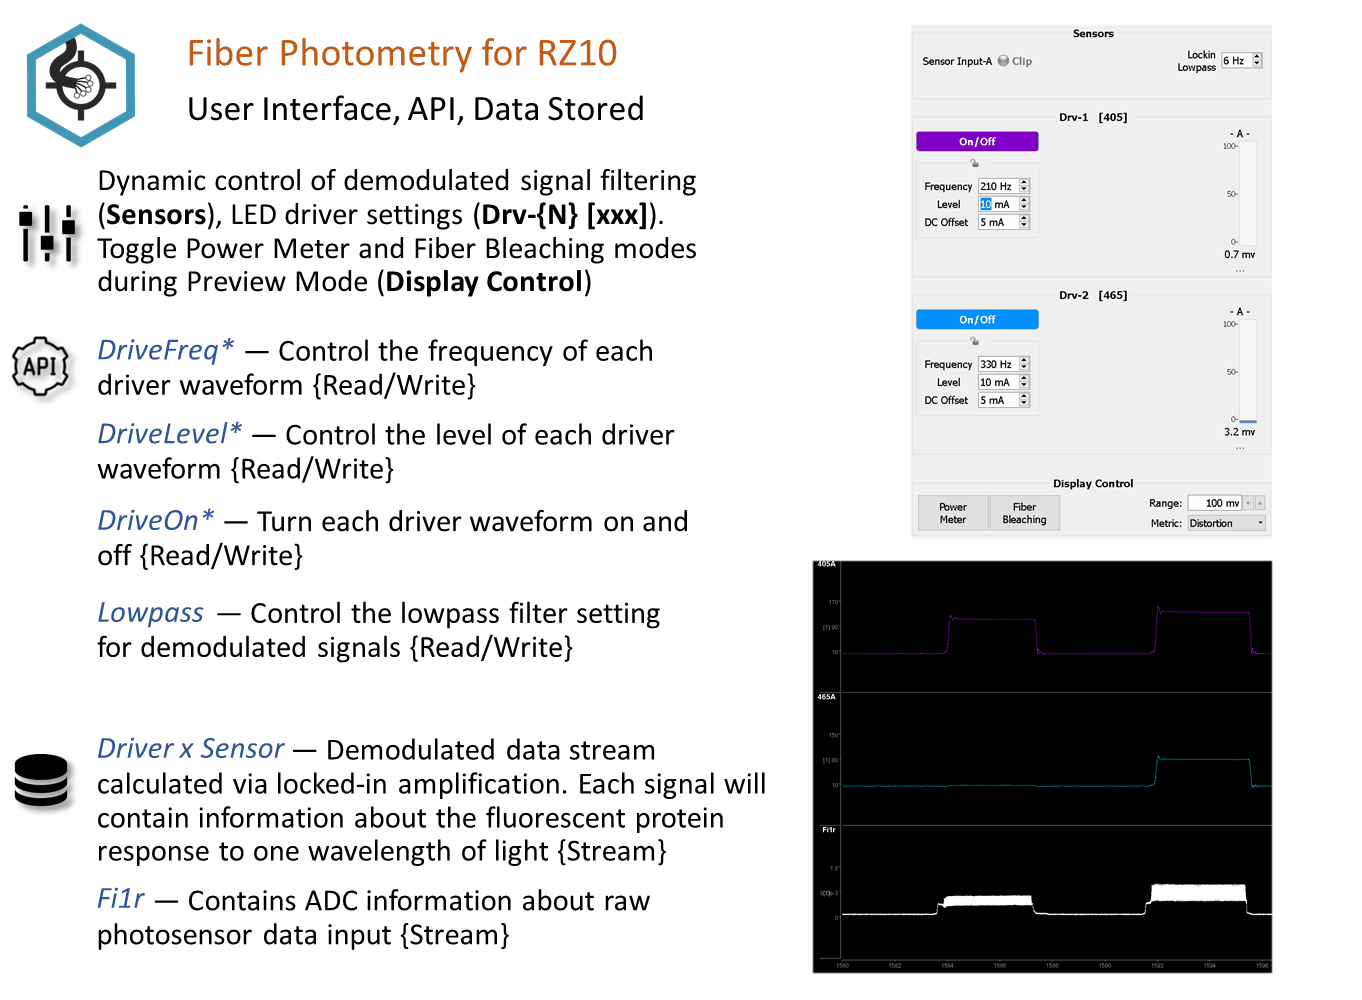
Runtime Controls
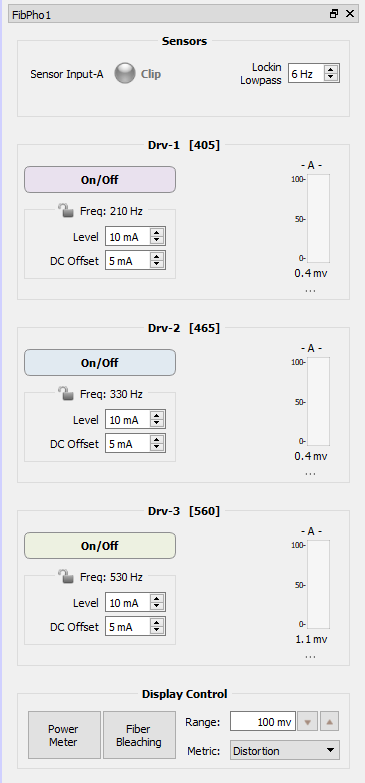 |
|
Runtime Interface |
Note that the Power Meter and Fiber Bleaching modes are only available in
Preview mode. Power Meter mode is for system verification, and Fiber Bleaching
is a special feature that doesn't involve data collection, so these modes can't
be accidentally enabled during an experiment (Record mode).
| Sensor(s) Options |
Description |
| Clipping Indicator(s) |
An indicator for each sensor flashes when the user-defined clipping threshold is passed. The clipping indicator will also light up if the input voltage is below 10 uV to indicate a bad connection. If a PM1 is detected, the clipping indicator for the PM1 will only be active when 'Power Meter' in the Display Control settings is enabled. |
| Lockin Lowpass |
Control the lowpass filter that determines the bandwidth around each demodulation frequency used for the power calculation |
| Drv-{n} Options |
|
| On/Off |
A button enables the light driver and indicator when the light is on. If the driver has the name of the LED wavelength then this button color will match the LED wavelength. |
| Parameters |
Knobs and value entry boxes allow runtime control of light driver Frequency, Level, and DC Offset parameter values. The 'Lock Freqs at Runtime' setting disables the Frequency control, and the 'Auto-Calc Offsets' setting disables the DC Offset control.
If Launch Power Est is set in the Light Driver(s) Tab during designtime, then the estimated light power output will be displayed next to the Level. |
| Results |
A result for each sensor is dynamically displayed as a single value in millivolts |
| Display Control |
|
| Range |
Set the range of the response bar indicator |
| Metric |
Show an optional metric beneath the response bar.
Distortion measures the amount of signal distortion in the LED output signal relative to a pure sine wave at the set frequency. Distortion greatly impacts the demodulation measurement because it affects the frequency characteristics of the driving signal. While you want to keep the driving current low, you also want to make sure the distortion is low. This measure is shown as a Quality score on the runtime display and should ideally be >95%. During system setup use the Level and DC Offset settings to adjust this.
S/N gives a measure of the signal relative to noise measured at harmonics of the lockin lowpass frequency. |
Power Meter
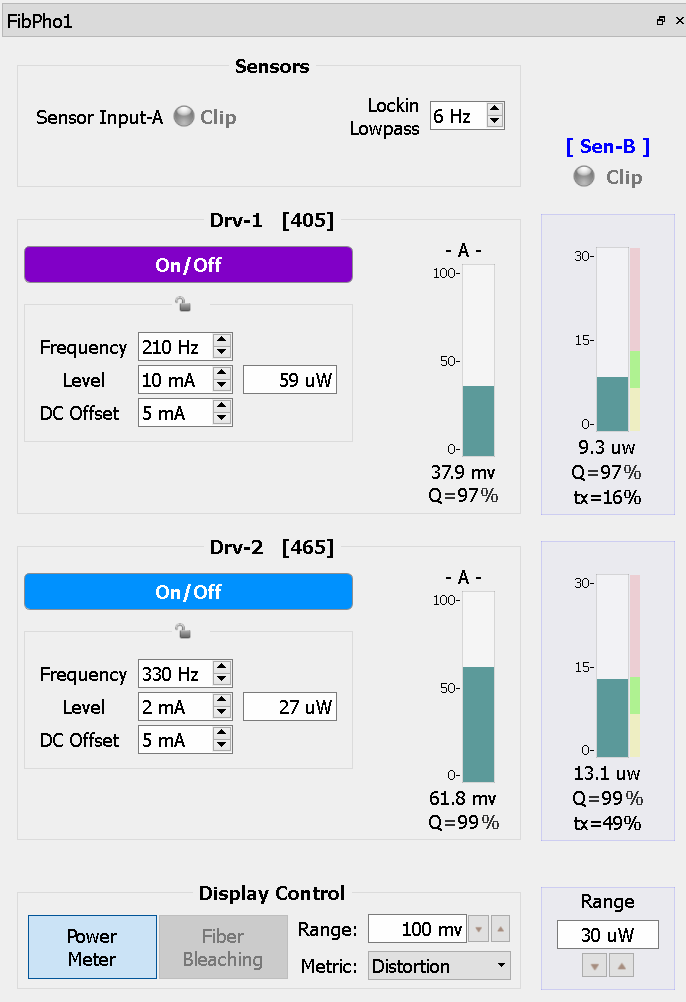 |
|
Runtime Interface for Power Meter Mode |
Note that the Power Meter mode is only available when a LUX PM1 is detected in
the RZ10x. This mode is for system verification and is only available in Preview
mode, so it can't be accidentally enabled during an experiment (Record mode).
| Sensor Options |
Description |
| Clipping Indicator |
The clipping indicator for the PM1 is displayed above the column of power indicators. |
| Drv-{n} Options |
|
| Indicators |
The measured power level at the driver frequency is shown next to each driver. The DC contribution of the individual driver is included in the power measurement for that driver. The colored bars to the right of the indicator show the designtime Target Range. The signal quality relative to a pure sine wave is displayed under the measured power.
If Launch Power Est is set in the Light Driver(s) Tab during designtime, then the total signal transmission through the system (tx) is also shown. |
| Display Control |
|
| Range |
Sets the maximum range of the power meter indicators |
Fiber Bleaching
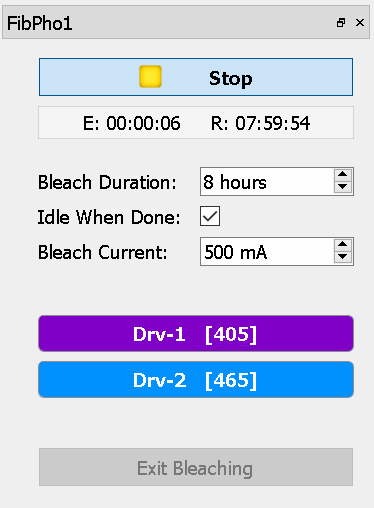 |
|
Runtime Interface for Fiber Bleaching Mode |
The Fiber Bleaching mode is a special feature for driving high light power
through the cables for an extended period of time to reduce the cable's
autofluorescence and increase signal to noise before running an experiment. This
mode doesn't involve data collection so it is only available in Preview mode, so
these modes can't be accidentally enabled during an experiment (Record mode).
Check with your fiber optic cable manufacturer for recommendations on fiber
bleaching current, duration, and how often this should be done.
| Setting |
Description |
| Start/Stop |
Use the Start/Stop button to begin or end the bleaching timer. The elapsed (E) and remaining (R) time are shown in the progress bar. |
| Idle When Done |
Check this box to automatically switch the system to Idle mode when the bleaching timer is done |
| Bleach Current |
Set the desired bleach current. Note that the current set here in Fiber Bleaching mode temporarily overrides the maximum current specified in the Light Driver(s) Tab during designtime. |
| Drv-{n} |
Select which light drivers to enable during bleaching |
Fiber Photometry Configuration Options
Driver(s) Tab
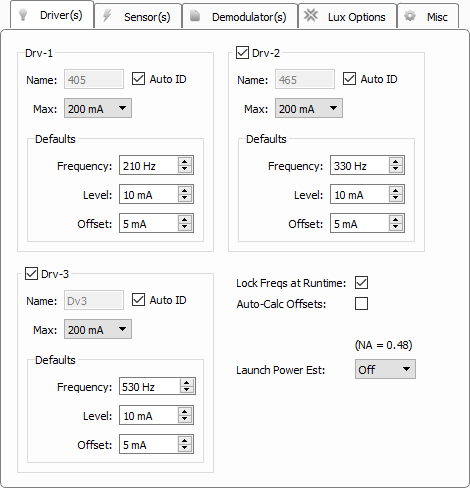 |
|
Driver(s) Tab |
| Drv-{n} Options |
Description |
| Name |
Three characters to identify the driver. If using integrated LUX LEDs, this defaults to the detected LED wavelength. If the name is the wavelength, the runtime button to enable the driver and runtime demodulation plots will be colored to match this wavelength. The name will be the first three characters in any demodulated store based on this driver signal. |
| Max |
Set the current output range as low as possible to match your desired driver signal. For the 1000 mA, 500 mA, and 200 mA settings, the actual driver hardware precision is adjusted to maximize dynamic range. The 50 mA setting uses the same driver precision as the 200 mA setting but allows you to adjust the Level/Offset in 0.1 mA increments at runtime, instead of the default 1 mA increment. This is useful if you are using a larger core diameter fiber on the LED outputs and need finer tuning to achieve lower signal output. In general, 200 mA is the recommended setting. |
| Defaults Options |
|
| Frequency |
Modulation frequency of the light source sine wave. |
| Level |
Peak-to-peak light source sine wave amplitude. |
| Offset |
DC shift added to the output sine wave. The offset is adjusted to reach the linear range of the physical light driver output and minimize signal distortion. More on that later. |
Lock Freqs at Runtime
Uncheck this for debugging or system setup, otherwise leave it unchecked to prevent accidental frequency changes during recording.
Auto-Calc Offsets
Automatically sets the Offset to 10% of the Level (rounded up) at runtime, with a minimum of 5 mA and maximum of 20 mA. This can reduce signal distortion at higher Level settings.
Launch Power Est
This option will display an estimate of the LED power output (in uW) at runtime through the selected fiber core diameter connected to the LED, assuming the cable Numerical Aperture is 0.48. Use this setting with a PM1 power meter to get an estimation of overall light transmission through the entire optical chain.
Sensor(s) Tab
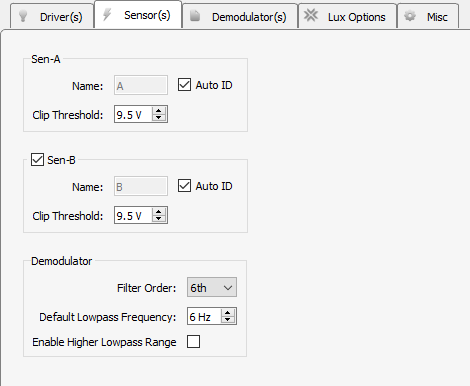 |
|
Sensor(s) Tab |
Note: PM1 power meters do not appear in this tab but are available in the
runtime interface in Preview mode.
| Sen-{x} Option |
Description |
| Name |
Sensor name as it will appear in the runtime interface. This defaults to A/B for the upper LUX bank, and C/D for the lower LUX bank. The first letter of the sensor name is used as the last letter of the demodulated store name. |
| Clip Threshold |
The runtime interface alerts the user if the raw A/D sensor input voltage value goes beyond this value. For the PS1 LUX sensor, this is set to 9.5 V. Other external photosensors may have a different clipping threshold. |
| Demodulator Option |
|
| Filter Order |
Higher order filters tighten the band around the response frequency |
| Default Lowpass Frequency |
Determines the band around the frequency of interest to do the demodulation calculation. This can be modified at runtime. |
| Enabled Higher Lowpass Range |
Check this box to raise the lowpass frequency limit to 100 Hz for TEMPO (voltage sensor photometry) where sensors have a wider bandwidth. See the Fiber Photometry User Guide for more information. |
Demodulator(s) Tab
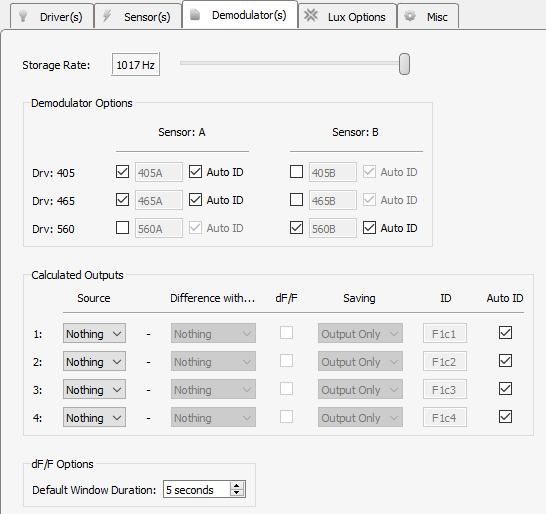 |
|
Demodulator(s) Tab |
Storage Rate
Set the storage sampling rate for the demodulated and calculated signals configured
on this tab.
Demodulator Options
Use the matrix of check boxes to select the combinations of sensors and drivers
that will be used for demodulation. All available sensor signals can be
demodulated against all light driver signals if desired.
Calculated Outputs
Perform up to four real-time calculations on the demodulated data streams.
Choose a Source demodulated signal, optionally subtract another demodulated
signal in the Difference with... column, and optionally perform a delta F over
F calculation on it (dF/F checkbox) to compare the strength of the signal
relative to the baseline.
Saving
The calculated signal is available as a gizmo output so other gizmos can attach
to it and do further processing in real-time. The calculated signal can also be
optionally shown on the Flow Plot at runtime, and optionally be saved to disk
as well.
dF/F Options - Default Window Duration
Sliding average window size used as the baseline for the delta F over F
computation.
Lux Options Tab
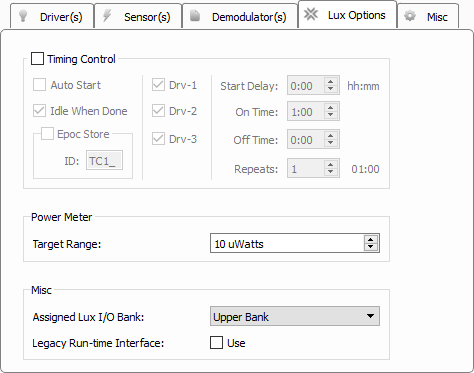 |
|
Lux Options Tab |
Timing Control
Timing control options are used to cycle the LEDs On and Off for set durations
and repeats during runtime. This feature is for running long (greater than 1
hour) experiments where photobleaching becomes a concern.
| Timer Option |
Description |
| Auto Start |
Automatically start the timer when entering runtime mode. Note that there is ~1 second delay after the start of recording before the timer begins. |
| Idle When Done |
Automatically return to Idle mode when the timer has finished |
| Epoc Store |
Store the onset/offset timestamps of when the driver signals were active |
| Drv-{n} |
Decide which drivers the timing control can control |
Power Meter
This option group is only available if a PM1 is detected in the RZ10x.
| Power Meter Option |
Description |
| Target Range |
Determines where to place the visual indicator next to the power meter at runtime for testing overall system power. 75% to 133% of this target value is color green. Anything below that range is colored yellow, and anything above is colored red. |
Misc
| Misc Option |
Description |
| Assigned Lux I/O Bank |
Only one gizmo can target each horizontal Lux I/O bank. Note: PM1 power meters are unique in that they can be accessed from any Fiber Photometry gizmo regardless of their physical bank location. So if you have an RZ10x you don't need to physically move the PM1 to measure power from both banks. |
| Legacy Run-time Interface |
Use the runtime interface from the Fiber Photometry gizmo for non-RZ10 devices |
Misc Tab
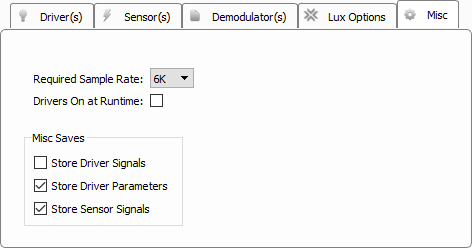 |
|
Misc Tab |
Required Sample Rate
Tells the RZ what minimum sample rate this gizmo requires. Typically 6K is
enough. Only increase this if the driver frequency needs to go beyond 1-2 kHz for
your experiment, which is rarely done.
Drivers On at Runtime
Check this option if you want to automatically turn on the LED drivers when
switching to Preview or Record mode.
Store Driver Signals
Stores the signals used to drive the LEDs at the RZ10x system rate. The store
name is the first two letters of the gizmo name, followed by the last letter of
gizmo name, followed by 'd' (default 'Fi1d'). One channel per light driver.
Store Driver Parameters
All light driver parameters are timestamped and stored to disk two seconds after
a change has been made to any of the driver parameters in the runtime user
interface. The store name is the first two letters of the gizmo name, followed
by the last letter of gizmo name, followed by 'i' (default 'Fi1i').
Store Sensor Signals
Stores the raw sensor signals at the RZ10x system rate. The store name is the
first two letters of the gizmo name, followed by the last letter of gizmo name,
followed by 'r' (default 'Fi1r'). One channel per sensor.