Troubleshooting FAQs
Why do my TTL inputs and/ or data seem delayed by approximately 1 second?
Smooth Scrolling
What you are seeing is a purely visual delay caused by a setting called Smooth Scrolling. Smooth scrolling creates an ~1 second delay on inputs in the flow plot (this is purely visual, the data itself is not delayed). This setting is on by default when you install Synapse. You can turn this off in Menu → Preferences → Run-Time Ops → Smooth Scrolling. Here is a link to a Lightning Video showing the effects of smooth scrolling.
I can no longer see any gizmos or gizmo settings
Synapse Window Divider
There is a vertical divider between the Processing Tree and gizmos/ gizmo options in Synapse. This divider is a thin blue line. When the gizmo pane collapses, that line will be on the far right of Synapse window. Click and drag the blue line back to the left to recover the gizmos and gizmo options pane. Clicking on the line can be tricky - the line will become highlighted and darken once you successfully made a click.
Synapse is crashing or erroring out -- how can I fix this?
Synapse Crashing or Erroring Out
Please refer to Investigating a Synapse Crash below.
Why is the 'Record' button grayed out in Synapse?
Record Button Grayed Out
The Record button will be grayed out if 'User' (optional), 'Experiment', or 'Subject' information is not selected. These categories will have a red icon in this case. Please select a known User (if applicable), Experiment, and Subject, or save a new one by clicking on the category and picking from one of the options.
 |
| A valid experiment name is not selected |
My experiment was working before and now it does not do what I expect – what changed?
Experiment Revision and Persistence
First, make sure you are on the correct experiment name and subject name. Runtime settings are tied to both the experiment and subject name, not just the experiment name. If you are on the correct Experiment and Subject, then you can investigate whether an experiment or its runtime settings have been modified by checking the revision logs or the persistence logs.
Revision Log
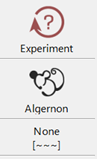
The revision log contains the history of all compiled changes made to an experiment. You can access this by clicking on the experiment name and selecting 'Revision Log'
 |
| Revision log for the 'FibPho' experiment |
If you check 'Show Detailed Changes,' then you can see when gizmos were Added, Deleted, or Changed between each experiment compilation. You can also mark experiment versions as 'Stable,' so that you always have a known good experiment to return to.
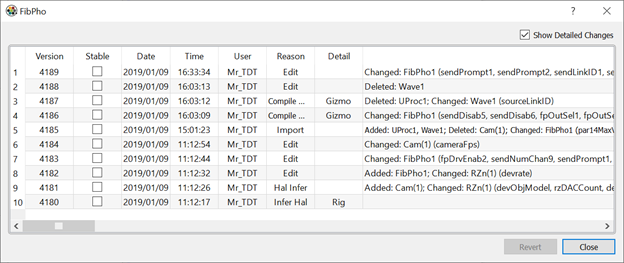
Persistence Log
The persistence log ('History') contains the history of all changes made to an experiment during runtime. You can access the persistence by clicking the '...' button on the side bar or in Menu → History. You can filter by 'Record' or 'Preview' mode, and by Date, User, Subject, and Experiment name. For any preview or recording, you can select an experiment and see which settings were adjusted. The readout will have the name of the gizmo and the setting {"Gizmo Name": {"Setting 1": value, "Setting 2": value}}. You can revert to settings used before or after any experiment by right-clicking the experiment in Sessions and choosing 'Use Starting State' or 'Use Ending State.' You can also revert to changes up to a point by right-clicking in Changes and selecting 'Use Changes Up to Here.'
The persistence settings you selected will be enacted the next time you go to Preview or Record mode.
 |
| Revision log for the 'FibPho' experiment |
We are upgrading our computer to Windows 11. What should I do?
Upgrading to Windows 11
Please refer to the Upgrading Windows for more details.
How can I transfer an experiment onto another computer with Synapse?
Transferring Experiments to Another Computer
First, you must export your experiment by clicking the Experiment name → 'Export'. With the *.synexpz file in hand, you can simply put it onto your other machine and drag + drop it into the Synapse processing tree. See the Import Experiment Lightning Video. Please note that your rig may be different between machines, which can affect how an experiment imports.
All my subjects and experiments are gone! What should I do?
Subject and Experiment Info Missing
First, take a deep breath, then go to C:\TDT\Synapse\Backups. This folder contains, among other things, your last known rig, experiment, and a copy of the synapse database (synapse-1.db). You can simply copy the .db file and put it in C:\TDT\Synapse. Once Synapse is restarted you should have recovered all your experiment and subject information.
You can also find copies of experiments used to record data in the .tin file (located with all the data files for a recording block). The .tin file is really a zip. Change the extension to .zip, then extract the files. You can then import the .synexpz files into your Synapse processing tree. See the Import Experiment Lightning Video.
Will upgrading Synapse ruin any of my experiments?
Upgrading Synapse
No, it will not. All new versions of Synapse (which are free to Synapse license holder) are compatible with older Synapse experiments. There are rare exceptions where a newer version of Synapse will cause a link between gizmos to break because the link has been renamed, but that is easily remedied by contacting support@tdt.com and asking for additional help.
To check for updates, go to Menu → About → Check for Updates. You will first need to install the latest TDT Drivers/ RPvdsEx from the Downloads page on our website and update your TDT processors to the latest microcode. Once that is finished, you can proceed with upgrading Synapse. You can also reference the How to Update Synapse page for more updating details.
Note that MATLAB and all other TDT applications must be closed during the upgrade process.
Why does my gizmo have an orange caution symbol on it?
Deprecated Gizmos
The caution symbol attached to certain gizmos indicates that these gizmos are deprecated. Deprecated gizmos are simply gizmos that have more modern replacements. There is no problem with your experiment if it is running a deprecated gizmo. Current deprecated gizmos include Electrical Stimulation and Local Field Potentials (LFP).
 |
| Local Field Potentials gizmo icon showing the deprecated gizmo symbol |
I have a '!Warning: Unable to find DSP for this object' message on one of my gizmos. What does this mean?
Unable to Find DSP Warning
DSP stands for digital signal processor. Your TDT processor has DSP cards inside of it that do all the computational heavy lifting. Each gizmo gets assigned to a DSP when Synapse compiles an experiment. On any given DSP there is a maximum number of Cycle Usage (CY), Components (CP) and memory (PM, DM, XM) that can be utilized. Below is a picture showing a gizmo compiled on DSP '2' with the various categories filled out:
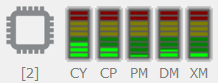 |
| Example assignment of a gizmo onto DSP 2. The various DSP category bars are filled based on how much processing, components, and memory are required |
When a '!Warning: Unable to find DSP for this object' message appears, this means that Synapse was unable to compile your experiment because it ran out of DSP processing power. In most cases, this is because the Cycle Usage limit was exceeded. There are several ways to try to remedy the situation:
-
Check if the Compiler Optimizer is on in Menu → Preferences → Advanced. Also, increase the 'Compiler Passes' parameter from the default 3 to 6 or more.
-
Check your RZ or RX processor 'Master Device Rate' in the 'Main' tab. Is the sampling rate for the processor needed for this experiment, or can it be lowered? Often when there is a DSP warning it is because the sampling rate is too high. The cycle usage on a gizmo is directly related to the sampling rate. If CY is 20% full on a gizmo when the sampling rate is 6k, then it will be 40% full when the sampling rate is doubled to 12k.
-
If you cannot change the sampling rate, then try unchecking 'Load Optimization' in the 'Main' tab of your RZ gizmo and drag the Processing slider all the way to the right (for v92 of Synapse or higher). This will increase Synapse's CY threshold before it decides it cannot compile an experiment. This does not increase the physical limit on the DSP, however, and in most cases 'Load Optimization' should be on.
If these options do not work, please contact support@tdt.com for more help.
All my flow plots are gone or are blank. What should I do?
Reset Flow Plot
Sometimes your flow plot may be blank and your traces stop showing. First, try autoscaling a trace to make sure it isn't just shifted. If that does not work, then you will need to reset your flow plot. To do this, go to Idle → RT Layout → Clear all to Default. This will reset the flow plot. Your plots should reappear the next time you go to Preview or Record.
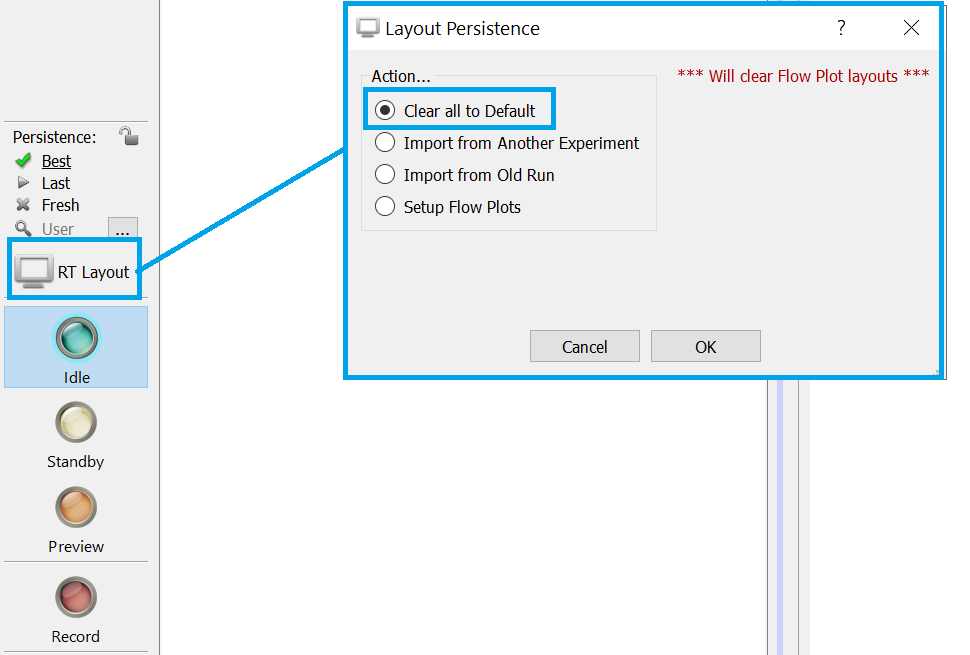 |
| Reset your flow plot in Synapse |
Investigating a Synapse Crash
First Things to Check
If you are experiencing a Synapse or TDT program crashing or erroring out, here are some quick things to check first which may solve the issue:
-
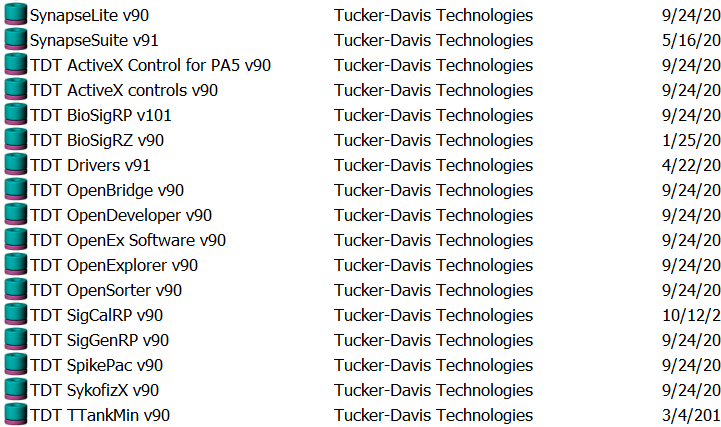
Check the version number of all TDT programs installed. Browse to Windows Programs and Features to look. All TDT software will have a Tank icon and the publisher will be Tucker-Davis Technologies.
Mismatches in program version numbers can cause crashes because certain files are shared between programs. If there is a mismatch, please go to our Downloads page update everything to the latest version.
You should also check for general TDT updates. In Synapse go to Menu → About → Check for Updates to see if there is a new release of Synapse available. If applicable, also update your TDT Drivers/ RPvdsEx and DSP microcode following the instructions here.
-
Check your computer power settings. Your sleep and monitor settings should be set to 'Never', and your PCI Express → Link State Power Management should be set to 'Off'. Please see Tech Note 0174 for more detail.
Restoring Synapse in the Event of a Complete Computer Crash or Computer OS Upgrade
Synapse information is easily restored or transferred between computers
because everything in Synapse (besides the data itself) is saved to a
database file (.db). The db file will help to restore all your
experiments, subjects, and runtime settings. There is a folder
C:\TDT\Synapse\Backups that contains:
-
The last hardware rig you used (.synrig)
-
A UserSettings.ini file
-
The Synapse database file (.db).
To restore your Synapse configuration on any computer:
-
Install TDT Drivers and Synapse on the new machine.
-
Replace
synapse-1.dbinC:\TDT\Synapsewith the .db file from your Backups folder. TDT recommends renaming synapse-1.db to synapse-1.db.old first, and then just dropping in the newsynapse-1.dbfrom Backups. -
Import the rig file (.synrig) via Menu → Edit Rig → Import.
-
Last, you can place your older UserSettings.ini file in
C:\Users\{username}\AppData\Local\Tucker-Davis Technologies\Synapseto restore all your Menu → Preferences settings.
If you are upgrading your Windows OS, please refer to the Upgrading Windows for more details.
Synapse Crashes When Going from Preview/Record to Idle
Symptom:
Synapse crashes after doing a session in Preview or Record mode when the user tries to go to Idle.
Possible Causes:
The most common problem is the graphics card (GPU). This crash typically happens when using PCA Spike Sorting or a Strobe Store gizmo with runtime plotting. These gizmos use advanced plotting modules. If you have an older GPU, outdated GPU drivers, or an integrated CPU graphics, then Synapse might crash.
Solutions:
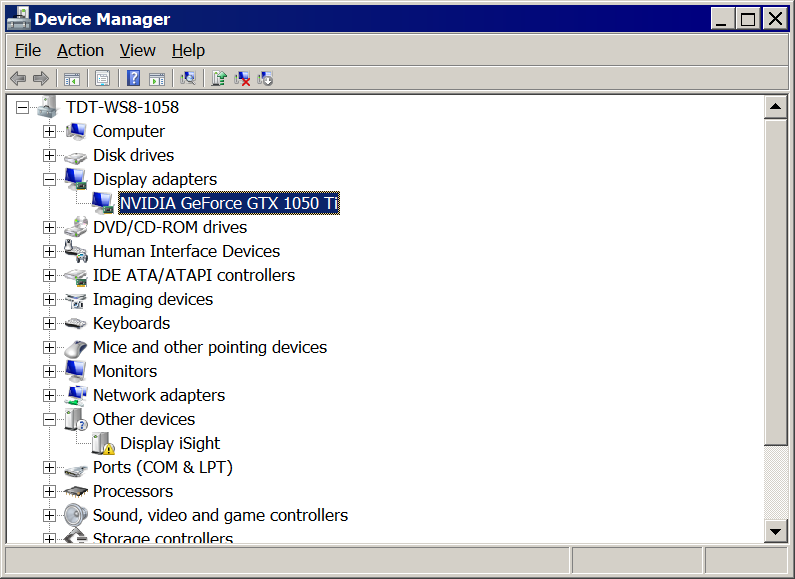
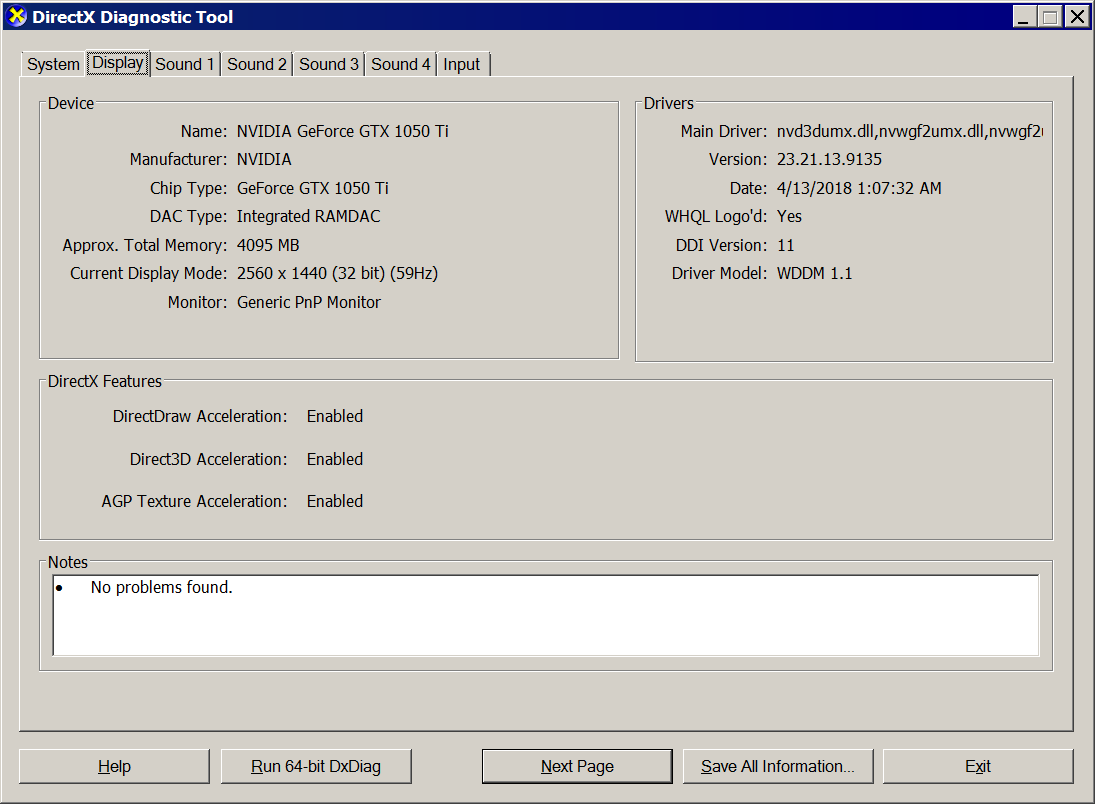
If you have a GPU, then try updating the GPU drivers. Be sure to look up the exact type of GPU and install the correct drivers. Often, if the customer has a NVIDIA or AMD card, there will be programs (GeForce, Radeon) installed to help find new drivers. You can figure out which graphics card is installed by going to Device Manager Display adapters (see first image). You can also run the dxdiag command in the windows Start Run dxdiag and check the Display tab (see second image).
If you have an integrated graphics processor (IGP), then you can also try to update the drivers.
If all else fails, try to run the experiment on a different computer with a dedicated GPU that has up-to-date drivers. If the experiment works without crashing, then the problem is the graphics.
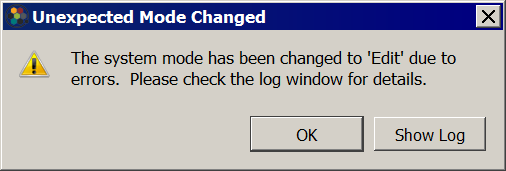
Synapse Errors Out During Preview/Record
Symptom:
Synapse errors out during a recording session (Preview or Record mode). Synapse displays "Trouble saving data to Tank" or "Tank unable to cache events" error message. During runtime there may also data dropouts.
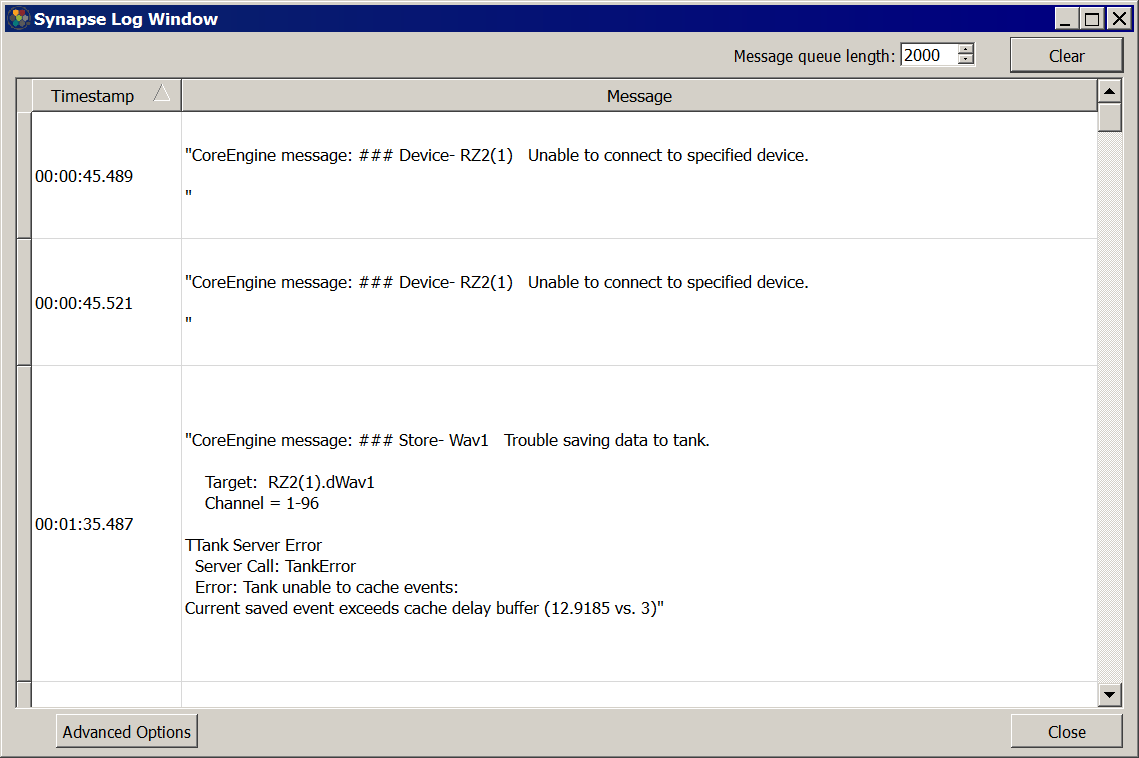
Possible Causes:
Most of the time, this error is caused by trying to save too much data to disc. Whenever the Synapse Tank Server writes to disc it checks the timestamp of the data. If the new data has a timestamp that is above a certain lag (the cache delay) from the last data written to disc, Synapse will report an error that it is falling behind (has limited readback/ trouble saving data to tank). The general guidelines for max data saving to disc are approximately 64 channels total x 24 kHz. If more data needs to be saved, then an RS4 might be needed.
In some cases, however, this error is caused by disconnection of the zBus equipment (RZ, RX) or a bad hard drive write.
The "Error reading scaler value from hardware" message could be a bad optical connection. Try reseating all fiber optic connections in your system and try again. This error can also occur if the RZ is not getting enough power, which can happen if a power hungry machine is connected to the same electrical outlet.
Solutions:
Tech Notes 0963 goes over this error and possible fixes in detail. Please follow the recommendations depending on the specific type of cache event error.
Synapse Errors Out When Opening Another TDT Program (BioSig, RPvdsEx, zBusMon, OpenEx)
Symptom:
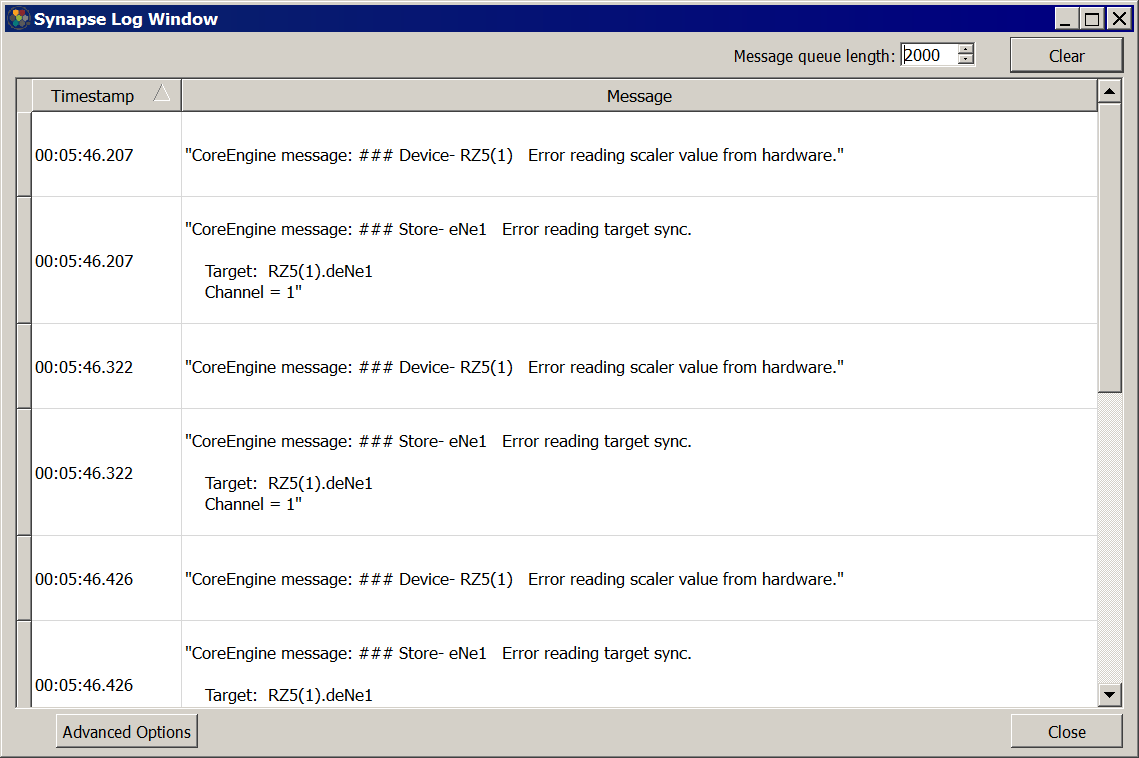
Synapse errors out when another program that tries to communicate with hardware is opened. Such programs include BioSigRZ, BioSigRP, SigGenRZ, SigGenRP, RPvdsEx, zBusMon, OpenEx, and SykoFizX. Synapse will quit recording and errors such as "Error reading scaler value from hardware" and "Error reading target sync" will appear.
Possible Causes:
This happens because the other programs listed are attempting to communicate with the zBus hardware (RZ, RX) at the same time as Synapse.
Solutions:
Do not open any TDT programs that actively try to communicate with the hardware. Other programs, such as OpenScope, OpenSorter, OpenExplorer, OpenBrowser, OpenBridge are okay to open.
OpenScope, OpenExplorer, OpenSorter, OpenBrowser, OpenBridge Cannot Launch or Crash Upon Launch
Symptom:
Peripheral TDT software (Scope, Explorer, Sorter, Browser, Bridge) cannot launch properly or crash upon launch.
Possible Causes:
This is most likely due to a mismatch in software and TDT Driver versions.
Solutions:
Check the version number of all TDT programs installed. Browse to Windows Programs and Features to look. All TDT software will have a Tank icon and the publisher will be Tucker-Davis Technologies.
Mismatches in program version numbers can cause crashes because certain files are shared between programs. If there is a mismatch, please go to our Downloads page update everything to the latest version.
If your programs are all on the same version and you still cannot launch
the program, try running the executable for that respective program in
C:\TDT\Synapse\OpenEx. If this works, then change the shortcut for
that program.