Overview of MATLAB Offline Analysis Tools
Read block files directly from disk or SEV files directly from RS4.
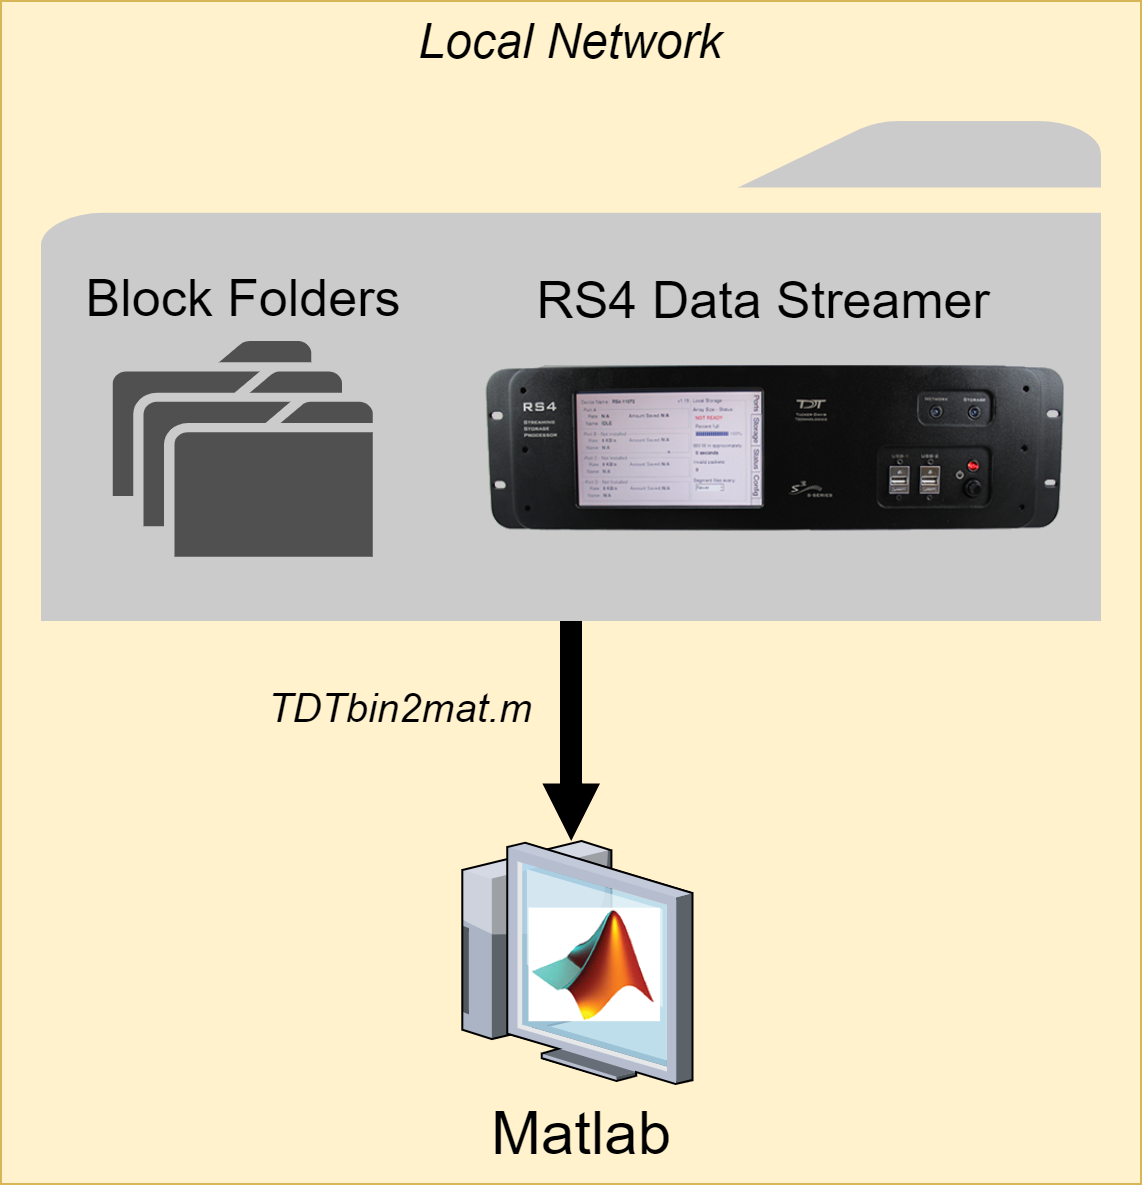
See TDT Data Storage for a description of the folder structure.
TDTbin2mat
TDTbin2mat is an all-in-one function for reading TDT data into MATLAB.
It needs only one input: the block path.
data = TDTbin2mat('C:\TDT\Synapse\Tanks\Exp1-160921-120606\Sub1-1');
TDTbin2mat will return a structure containing all recorded data from
that block, organized by type. See TDT Data Types
for a description of the data types.
TDTbin2mat uses parameter value combinations to refine the imported
data. To extract specific event types only, use the 'TYPE' option. For
example, to import epocs and snippets only, use this:
data = TDTbin2mat('C:\TDT\TDTExampleData\Algernon-180308-130351', ...
    'TYPE', {'epocs', 'snips'})
Use the 'STORE' option to extract a particular data store by name, in
this example a streaming event called 'Wav1'. Combine this with the
'CHANNEL' option to extract a single channel, or list of channels, in this
case channel 2:
data = TDTbin2mat('C:\TDT\TDTExampleData\Algernon-180308-130351', ...
    'STORE', 'Wav1', 'CHANNEL', 2);
You can also filter by time, if you are only interested in portions of
the recording, or if the entire recording won't fit into available
memory (RAM) at one time. Use the 'T1' and 'T2' options to specify the
start and stop time, in seconds, to retrieve from the block. This
example reads only from time T1=10s to time T2=20s of the block into MATLAB:
data = TDTbin2mat('C:\TDT\TDTExampleData\Algernon-180308-130351', ...
    'T1', 10, 'T2', 20);
TDTbin2mat offers many more useful options that are described in its
help documentation.
>> help TDTbin2mat
TDTfilter
TDTfilter applies advanced epoc filtering to extracted data. For
example, if you only want to look at data around a certain epoc event,
you will use TDTfilter to do this. See the
Raster/PSTH example
for a complete demonstration.
To only look at data around the epoc event timestamps, use a 'TIME'
filter. In this example, data from 20 ms before the Levl epoc to 50ms
after the onset is retained.
data = TDTfilter(data, 'Levl', 'TIME', [-0.02, 0.07]);
To only look at data when an epoc was a certain value, use a 'VALUES'
filter. In this example, only data when the Freq epoc was equal to
9000 or 10000 is retained.
data = TDTfilter(data, 'Freq', 'VALUES', [9000, 10000]);
If you want to look for a particular behavioral response that occurs
sometime during the allowed time range, use the 'MODIFIERS' filter. In
this example, only data when the Freq epoc was 10000 AND the Resp
epoc had a value of 1 sometime during the Freq epoc is retained.
data = TDTfilter(data, 'Freq', 'VALUES', [10000]);
data = TDTfilter(data, 'Resp', 'MODIFIERS', [1]);
As you can see, for complex filtering the output from one call to
TDTfilter can become the input to the next call to TDTfilter. If your
data sets are large, or if you are iterating through many combinations
of epoc variables, it is preferred to extract only the epocs and do all
of the epoc filtering first to find the valid time ranges that match the
filter, and then use this as the 'RANGES' input to TDTbin2mat to extract
all events (including snips, streams) on only those valid time ranges.
% read just the epoc events
data = TDTbin2mat(block_path, 'TYPE', {'epocs'});

% use the epocs to find time ranges we want
data = TDTfilter(data, 'Freq', 'VALUES', [9000, 10000]);
data = TDTfilter(data, 'Levl', 'VALUES', [70, 80, 90]);
data = TDTfilter(data, 'Resp', 'MODIFIERS', [1]);

% read just the value time ranges from the whole data set
data = TDTbin2mat(block_path, 'RANGES', data.time_ranges);
SEV2mat
SEV2mat reads SEV files into a MATLAB structure. SEV files are created
by the RS4 Data Streamer or by enabling the Discrete Files option when
streaming continuous signals in Synapse. SEV files consist of a single
channel of data per file, with a short header, so it is very fast to
read them. TDTbin2mat will automatically call SEV2mat if it finds SEV
files in the block directory. Like TDTbin2mat, SEV2mat needs only one input:
the block path.
data = SEV2mat('C:\TDT\Synapse\Tanks\Exp1-160921-120606\Sub1-1');
SEV2mat will return a structure containing the streams that it found.
Each stream field includes the data array and sampling rate.
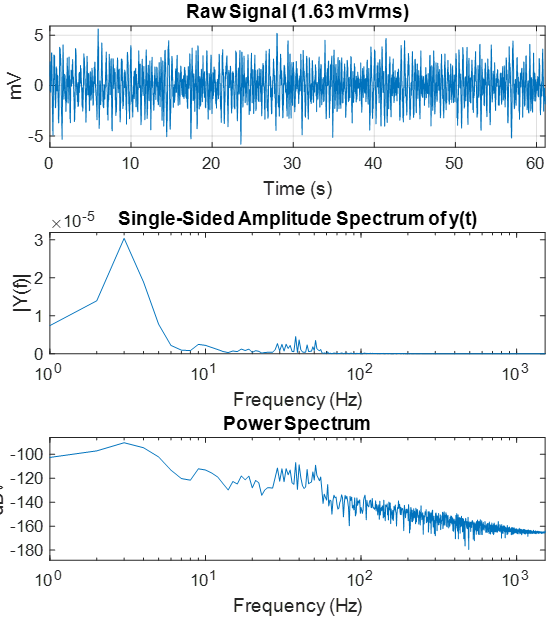
TDTfft
TDTfft performs frequency analysis on the data stream. It takes the
stream data output of TDTbin2mat and a channel number as inputs. In this
example, it is plotting channel 1 of the 'LFP1' store from an example
block.
data = TDTbin2mat('C:\TDT\TDTExampleData\Algernon-180308-130351');
TDTfft(data.streams.LFP1, 1);
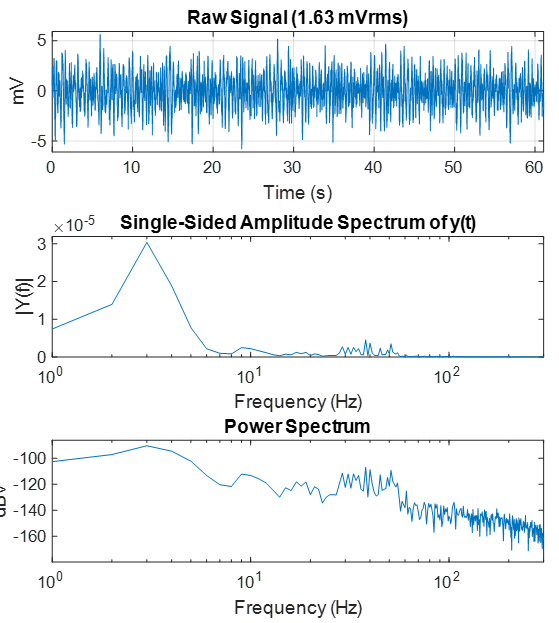
Use the 'FREQ' input to specify the frequency range that you're
interested in.
% look at frequencies 0 Hz to 300 Hz only
TDTfft(data.streams.LFP1, 1, 'FREQ', [0, 300]);
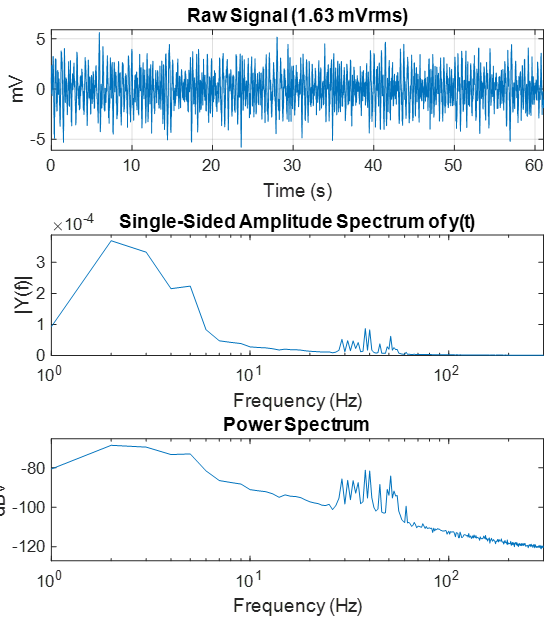
Often the frequency plot is noisy. Use the 'NUMAVG' input to smooth out
the frequency plot and better isolate the components with the most power
through the entire recording. This breaks the data into chunks, performs
the FFT on those chunks, and then plots the average.
% split data up into 20 chunks and plot average FFT
TDTfft(data.streams.LFP1, 1, 'FREQ', [0, 300], 'NUMAVG', 20);
Set the 'SPECPLOT' input to 1 to also display a spectrogram of the
entire data stream. If the data set is too long then MATLAB could run
out of memory to do this, and you would need to use the T1 and T2
parameters in TDTbin2mat to look at smaller chunks of data.
data = TDTbin2mat('C:\TDT\TDTExampleData\Algernon-180308-130351', 'T2', 10);
TDTfft(data.streams.LFP1, 1, 'FREQ', [0, 100], 'NUMAVG', 20,'SPECPLOT', 1);
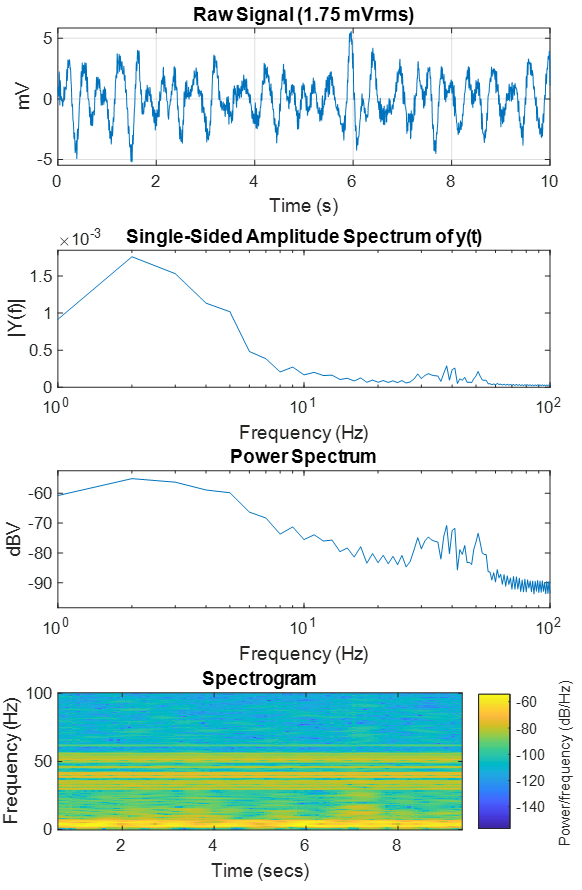
See the LFP plot example for a full demonstration.
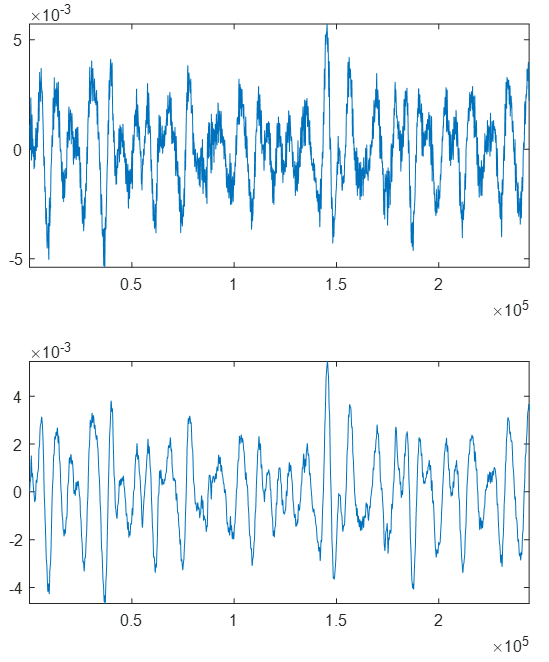
TDTdigitalfilter
TDTdigitalfilter mimics the hardware digital filters in the Neural
Stream Processor gizmo.
It takes the output of TDTbin2mat and applies
the specified digital filter to the specified streaming data store. Here
is a simple DC-20 Hz bandpass filter example:
data = TDTbin2mat('C:\TDT\TDTExampleData\Algernon-180308-130351', 'T2', 10);
subplot(2,1,1);
plot(data.streams.Wav1.data(1,:));
data = TDTdigitalfilter(data, 'Wav1', [0, 20]); % look at 0-20 Hz only
subplot(2,1,2);
plot(data.streams.Wav1.data(1,:));
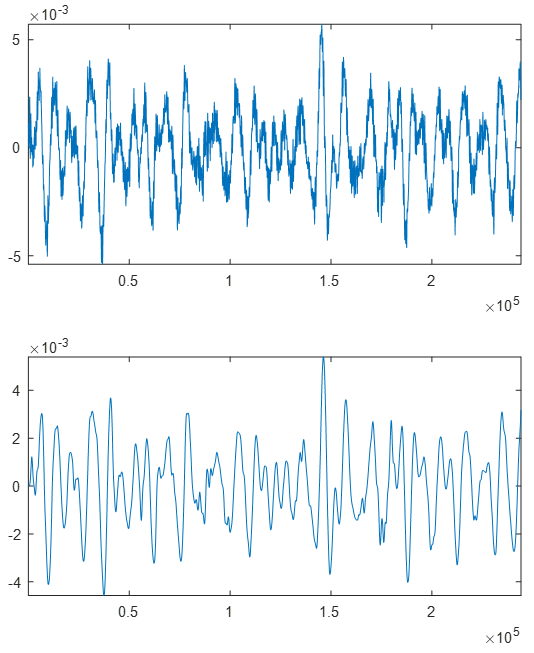
Use the 'ORDER' input to set the filter order. By default it is a 2 for
a second order filter.
data = TDTdigitalfilter(data, 'Wav1', [0, 20], 'ORDER', 8);
You can also add a notch filter.
data = TDTdigitalfilter(data, 'Wav1', 'NOTCH', 60, 'ORDER', 4);
TDTthresh
TDTthresh takes continuous data and applies a thresholding algorithm to
extract snippets. It has two modes, 'manual' and 'auto'. In 'manual'
mode, supply the absolute threshold input 'THRESH' to extract
snippets. Can be negative for negative-first spike detection.
In 'auto' mode, a multiple of the sliding RMS window is used to
calculate the instantaneous threshold. Set the 'TAU' parameter to
specify the time window, and set the 'STD' parameter to set the scalar.
So if TAU=5 and STD=6, then the threshold will track 6*RMS of the
previous 5 seconds.
The new snippet store generated from TDTthresh is called 'Snip'.
data = TDTbin2mat('C:\TDT\TDTExampleData\Algernon-180308-130351', 'T2', 10);
data = TDTdigitalfilter(data, 'Wav1', [300 5000]);
data = TDTthresh(data, 'Wav1', 'MODE', 'auto');
subplot(2,1,1);
plot(data.streams.Wav1.data(1,:));
subplot(2,1,2);
plot(data.snips.Snip.data');
You can set the 'TETRODE' flag to extract snippets organized by groups
of 4 channels. If the threshold crosses on one channel, all 4 channels
will get a snippet.
TDTthresh has a few more customizations you can explore in its help
documentation.
>> help TDTthresh
See the Rethreshold Example for a complete demonstration of
TDTdigitalfilter and TDTthresh.