Note Filter Example
Import streaming EEG data into MATLAB using TDTbin2mat
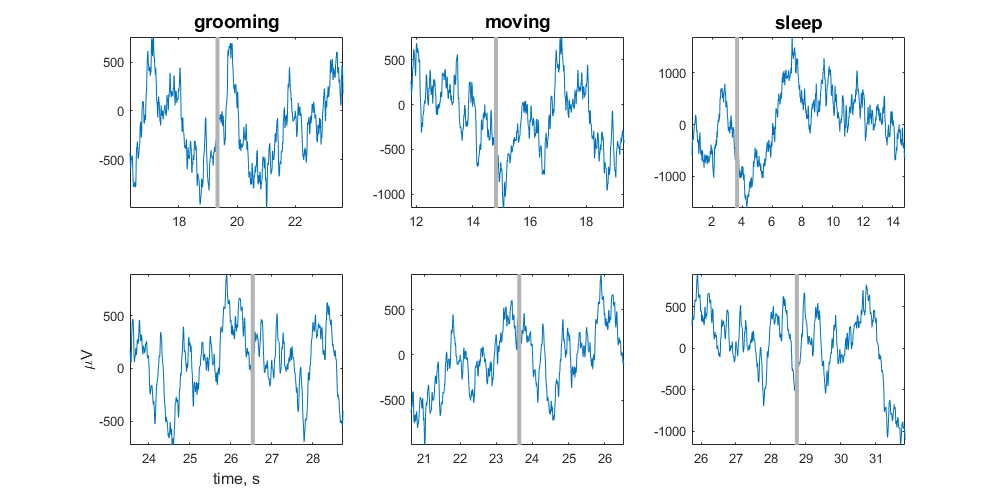
Filter around behavioral events that were timestamped by the user
using the Run-time Notes feature in Synapse
Plot each occurrence in a subplot organized by Note type
Good for sleep scoring and behavioral discrimination
Housekeeping
Clear workspace and close existing figures. Add SDK directories to MATLAB path.
close all; clear all; clc;
[MAINEXAMPLEPATH,name,ext] = fileparts(cd); % \TDTMatlabSDK\Examples
DATAPATH = fullfile(MAINEXAMPLEPATH, 'ExampleData'); % \TDTMatlabSDK\Examples\ExampleData
[SDKPATH,name,ext] = fileparts(MAINEXAMPLEPATH); % \TDTMatlabSDK
addpath(genpath(SDKPATH));
Importing the Data
This example assumes you downloaded our example data sets and extracted it into the \TDTMatlabSDK\Examples directory. To import your own data, replace 'BLOCKPATH' with the path to your own data block.
In Synapse, you can find the block path in the database. Go to Menu → History. Find your block, then Right-Click → Copy path to clipboard.
BLOCKPATH = fullfile(DATAPATH,'Subject1-180426-120951');
Set up the variables for the data you want to extract. We will extract channel 1 from the EEG1 stream store.
STORE = 'EEG1';
CHANNEL = 1;
ONSET = -3; % relative onset, in seconds, from the note timestamp
Now read the specified data from our block into a MATLAB structure.
data = TDTbin2mat(BLOCKPATH, 'CHANNEL', CHANNEL);
Found Synapse note file: C:\TDT\TDTMatlabSDK\Examples\ExampleData\Subject1-180426-120951\Notes.txt
read from t=0.00s to t=31.81s
All notes are stored in a special epoc event called 'Note'
% find all the unique note values
notes = unique(data.epocs.Note.notes);

% find the highest number of occurrences (to inform our plot)
maxOccur = max(cell2mat(cellfun(@(x) sum(ismember(data.epocs.Note.notes,x)),notes,'un',0)));
Loop through the notes for plotting
h = figure;
for i = 1:numel(notes)

    fprintf('Reading note: %s\n', notes{i})

    % look at only the data around this note type
    filtered = TDTfilter(data, 'Note', 'VALUES', notes{i}, 'TIME', ONSET);

    % for each note occurrence, plot the data from the note onset to the next note onset
    n = numel(filtered.streams.(STORE).filtered);
    for j = 1:n
        plotInd = (j-1)*numel(notes)+i;
        subplot(maxOccur,numel(notes),plotInd);

        % x-axis is the valid time ranges, in seconds
        ts = filtered.time_ranges(1,j) + double(1:size(filtered.streams.(STORE).filtered{j},2))/filtered.streams.(STORE).fs;

        % plot the snippet, in microvolts
        plot(ts, 1e6*filtered.streams.(STORE).filtered{j}'); hold on;

        % if we specified an ONSET, draw the vertical line at the note onset.
        if ONSET ~= 0
            line((ts(1)-ONSET)*[1 1], [min(1e6*filtered.streams.(STORE).filtered{j}') max(1e6*filtered.streams.(STORE).filtered{j}')], 'Color',[.7 .7 .7], 'LineStyle','-', 'LineWidth', 3);
        end

        % plot labels
        if j == 1
            title(notes{i},'FontSize',14)
        elseif j == n
            if i == 1
                ylabel('\muV','FontSize',12)
                xlabel('time, s','FontSize',12)
            end
        end
        axis tight;
    end
end

set(gcf, 'Position',[100, 100, 1000, 500])
Reading note: grooming
Reading note: moving
Reading note: sleep