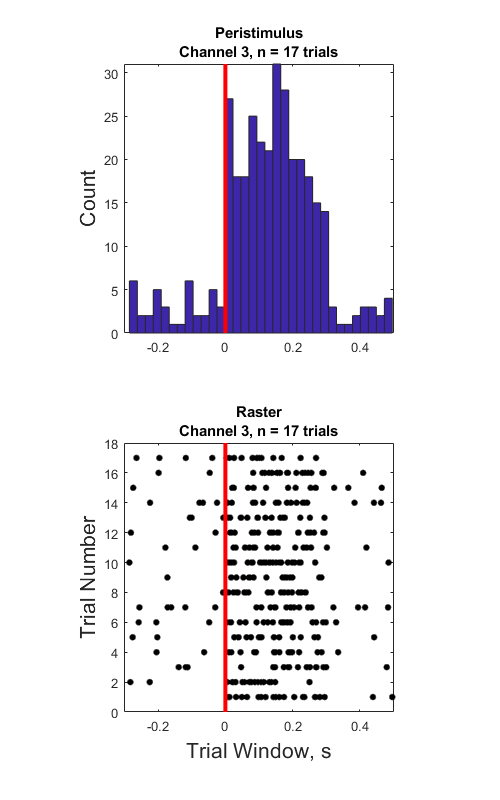
Raster Peristimulus Time Histogram (PSTH) Example
Import snippet and epoc data into MATLAB using TDTbin2mat
Generate peristimulus raster and histogram plots over all trials
Good for stim-response experiments, such as optogenetic or electrical
stimulation
Housekeeping
Clear workspace and close existing figures. Add SDK directories to MATLAB path.
close all; clear all; clc;
[MAINEXAMPLEPATH,name,ext] = fileparts(cd); % \TDTMatlabSDK\Examples
DATAPATH = fullfile(MAINEXAMPLEPATH, 'ExampleData'); % \TDTMatlabSDK\Examples\ExampleData
[SDKPATH,name,ext] = fileparts(MAINEXAMPLEPATH); % \TDTMatlabSDK
addpath(genpath(SDKPATH));
Importing the Data
This example assumes you downloaded our example data sets and extracted it into the \TDTMatlabSDK\Examples directory. To import your own data, replace 'BLOCKPATH' with the path to your own data block.
In Synapse, you can find the block path in the database. Go to Menu → History. Find your block, then Right-Click → Copy path to clipboard.
BLOCKPATH = fullfile(DATAPATH,'Algernon-180308-130351');
Set up the variables for the data you want to extract. We will extract channel 1 from the eNe1 snippet data store, created by the PCA Sorting gizmo, and use our PulseGen epoc event ('PC0/') as our stimulus onset.
REF_EPOC = 'PC0/';
SNIP_STORE = 'eNe1';
SORTID = 'TankSort';
CHANNEL = 3;
SORTCODE = 0; % set to 0 to use all sorts
TRANGE = [-0.3, 0.8]; % window size [start time relative to epoc onset, window duration]
Now read the specified data from our block into a MATLAB structure. The 'NODATA' flag means that we are only interested in the snippet timestamps, not the actual snippet waveforms in this example.
data = TDTbin2mat(BLOCKPATH, 'TYPE', {'epocs', 'snips', 'scalars'}, 'SORTNAME', SORTID, 'CHANNEL', CHANNEL, 'NODATA', 1);
read from t=0.00s to t=61.23s
Use TDTfilter to extract data around our epoc event
Using the 'TIME' parameter extracts data only from the time range around our epoc event.
raster_data = TDTfilter(data, REF_EPOC, 'TIME', TRANGE);
Adding the 'TIMEREF' flag makes all of the timestamps relative to the epoc event, which is ideal for generating histograms.
hist_data = TDTfilter(data, REF_EPOC, 'TIME', TRANGE, 'TIMEREF', 1);
And that's it! Your data is now in MATLAB. The rest of the code is a simple plotting example. First, we'll find matching timestamps for our selected sort code (unit).
TS = raster_data.snips.(SNIP_STORE).ts;
if SORTCODE ~= 0
    i = find(raster_data.snips.(SNIP_STORE).sortcode == SORTCODE);
    TS = TS(i);
end
if isempty(TS)
    error('no matching timestamps found')
end

num_trials = size(raster_data.time_ranges, 2);
Make the histogram plot
figure('Position',[100, 100, 500, 800]);

hist_TS = hist_data.snips.(SNIP_STORE).ts;
subplot(2,1,1);
NBINS = floor(numel(hist_TS)/10);
hist(hist_TS, NBINS);
N = hist(hist_TS, NBINS); hold on;

axis tight; axis square;
set(gca, 'XLim', [TRANGE(1), TRANGE(1)+TRANGE(2)]);
ylabel('Count','FontSize',16);
title({'Peristimulus', sprintf('Channel %d, n = %d trials', CHANNEL, num_trials)});

% Draw a vertical line at t=0.
line([0 0], [0, max(N)], 'Color','r', 'LineStyle','-', 'LineWidth', 3);

% Creating the Raster Plot
% For the raster plot, make a cell array of timestamps for each trial.
all_TS = cell(num_trials, 1);
all_Y = cell(num_trials, 1);
for trial = 1:num_trials
    trial_on = raster_data.time_ranges(1, trial);
    trial_off = raster_data.time_ranges(2, trial);
    trial_TS = TS(TS >= trial_on & TS < trial_off);
    all_TS{trial} = trial_TS - trial_on + TRANGE(1);
    all_Y{trial} = trial * ones(numel(trial_TS), 1);
end
all_X = cat(1, all_TS{:});
all_Y = cat(1, all_Y{:});

% Make the raster plot.
subplot(2,1,2);
plot(all_X, all_Y, '.', 'MarkerEdgeColor','k', 'MarkerSize',15); hold on;
axis tight; axis square;
set(gca, 'XLim', [TRANGE(1), TRANGE(1)+TRANGE(2)]);
xlabel('Trial Window, s','FontSize',16);
ylabel('Trial Number','FontSize',16);
title({'Raster', sprintf('Channel %d, n = %d trials', CHANNEL, num_trials)});

% Draw a vertical line at t=0.
line([0 0], [0, trial+1], 'Color','r', 'LineStyle','-', 'LineWidth', 3);