Run-Time and Debugging
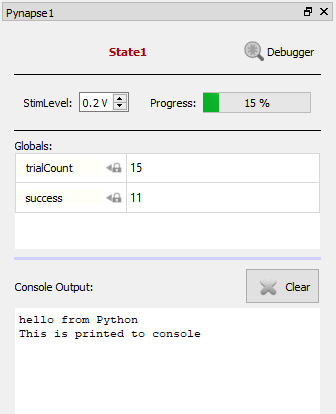
The Pynapse run-time interface has two modes. The default view shows the current
State in red text,
any Controls and Metrics
assets defined at design-time, and the Console Output shows any print outputs or
error messages from the Python code.
Debug View

Click the Debugger icon to open the expanded run-time view. This gives you a more
in-depth look at the events in Pynapse and allows you to manipulate the Pynapse state
and manually trigger events during the experiment.
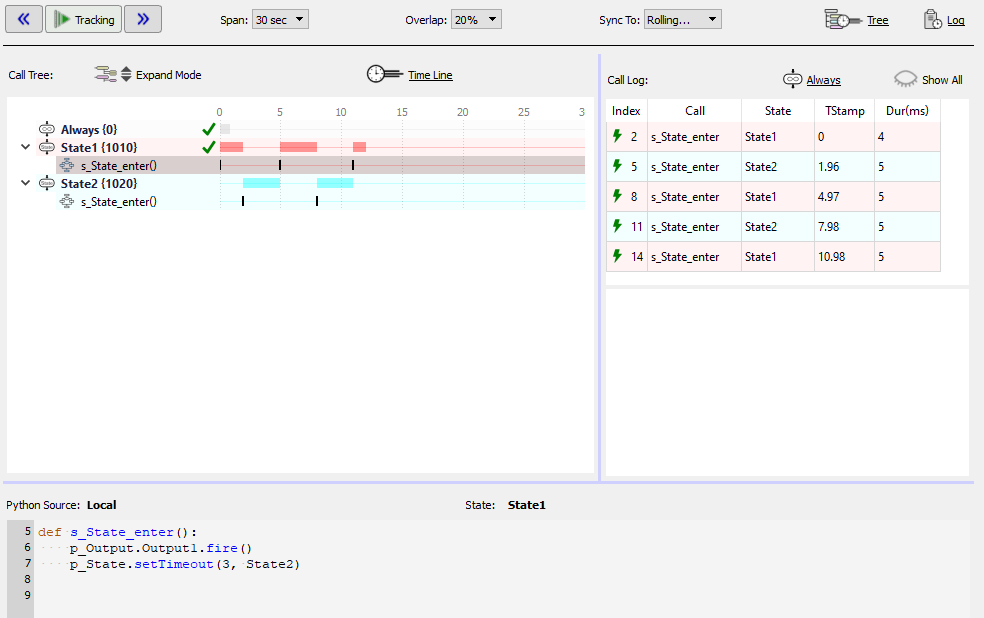
Call Tree
The Call Tree shows all the states and slot methods that Pynapse knows about. An icon next to the state/slot name gives you more status information:


Note
* The Always state is always also active and slot methods within it can always be triggered by Pynapse events
Expand Mode determines what methods to show within the states.


Time Line
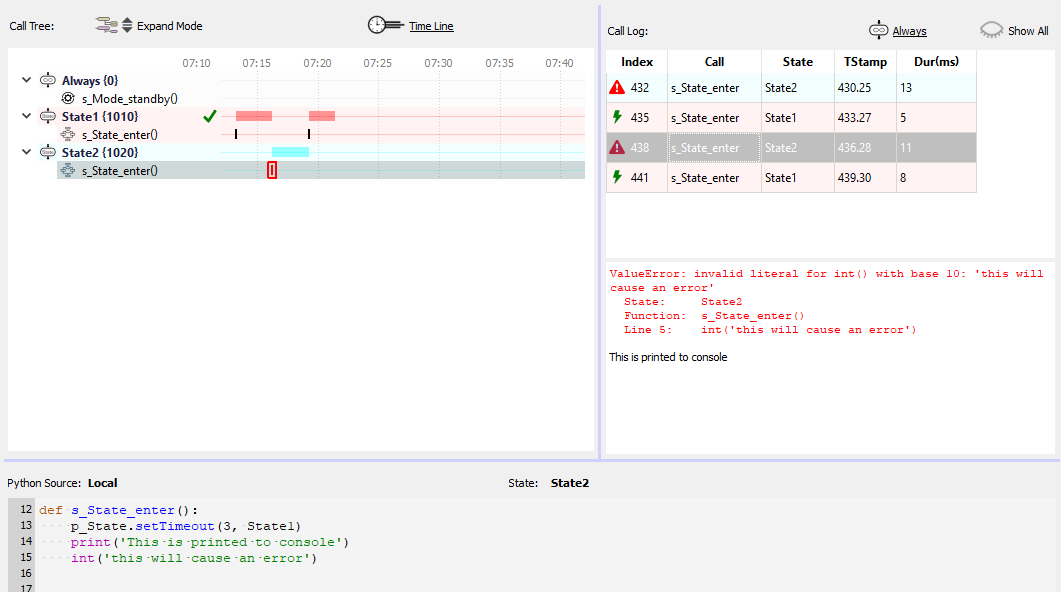
The Time Line shows when a state is active and when slot methods fired. If there was an error during the slot method, it will show a red bar. You can click on events in the time line to see more information about it in the Call Log.
The controls at the top can stop/resume the time line, or move backward/ forward in time for review.
Span is how much time to show in the time line. When it gets to the end it clears the time line and starts drawing from the left. Overlap is what percentage of the end of the previous time line to include when the time line refreshes.
Sync To can be used to reset the time line when a particular state change happens, so you can easily follow the events in a particular state. This is helpful for debugging rapid events using a short time Span.
Call Log
All Pynapse events are captured in the Call Log with a timestamp and the amount of time spent in that method.
Tip
The information shown here is also optionally saved to a text file with the rest of your data. Enable the Call Logging setting in the General Tab at design-time.


If you click on an event in the call log, that event will be highlighted in the Call Tree, and vice versa. If it was an error, it will be outlined in red.
The window underneath the call log shows the console output for the selected call, including any error messages generated by that call, so you can track it down in the source code.
Note
Pause the time line so the Call Log doesn't refresh while you are trying to look at the error messages.
Debugging
Manual Control
You can manually control the state flow in the Call Tree. Double-click on any state to switch Pynapse into that state. The event will be capture in the Call Log.
You can also double-click on a slot method to trigger it manually. This will not be captured in the call log.
Important
The Allow Run-Time Call Control check box on the General Tab at design-time must be enabled for manual control to work.
Code Viewing
The bottom of the Debugging window is a view of the source code. Click on a state or a slot method in the Call Tree to see its source.