Metrics
Metrics are global variables you can read/write in your Python logic code. They can also be added to the runtime interface for visual display, logged at certain time points in the trial, and plotted.
A metric can be any python object. This is similar to using the global keyword in Python,
except that by storing it as a Pynapse asset you can use the methods below to read and
modify it, and all of the logging and display/plotting is taken care of for you.
Give each variable a name and a default value in the Metrics Tab. If Session Controls are enabled, you can assign a metric to trials, blocks, or sessions. You can add up to 50 metrics.
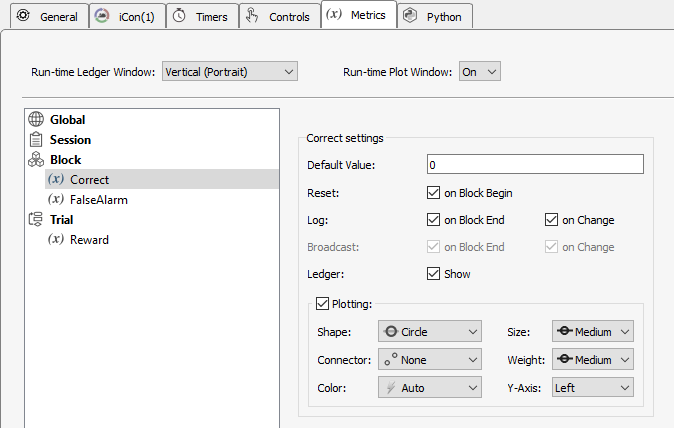 |
| Metrics Tab |
Important
*The metric resets 'on Trial Begin' after the function that calls startTrial exits.
In the example below, the MinPress metric will be 0 after s_State_enter finishes
and won't have the desired value. When manually setting metrics, turn off the 'Reset'
option.
class StartTrial:    # StateID = ?
    def s_State_enter():
        p_Session.startTrial()
        p_Metric.MinPress.write(random.randint(5,10))
Run-time Interface
The Metrics run-time interface can have two elements, the ledger and plot windows. Metrics are organized by scope - Session, Block, Trial, or Global.
Ledger
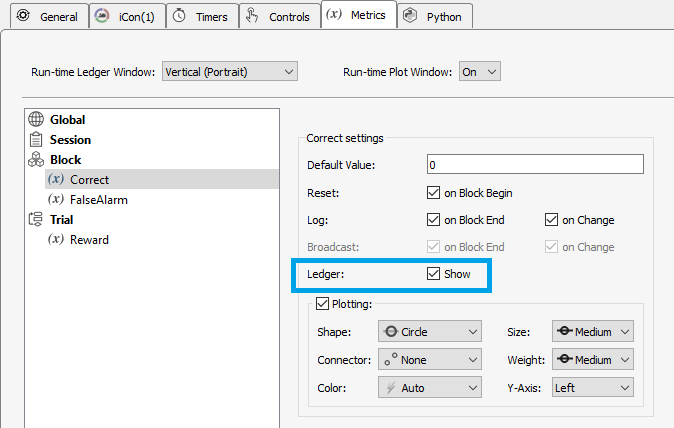 |
| Metrics Ledger Option |
Metrics with the Ledger option selected appear on the ledger. The numbers on the ledger
indicate the {SESSION}.{BLOCK}.{TRIAL} for that entry. New blocks / trials are
indicated with a -. The Run-time Ledger Window setting organizes the metric panes
either vertically or horizontally by default. The layout can be changed at run-time.
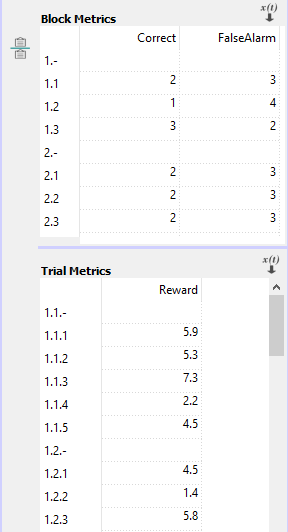 |
| Metrics Ledger Interface |


Plotting
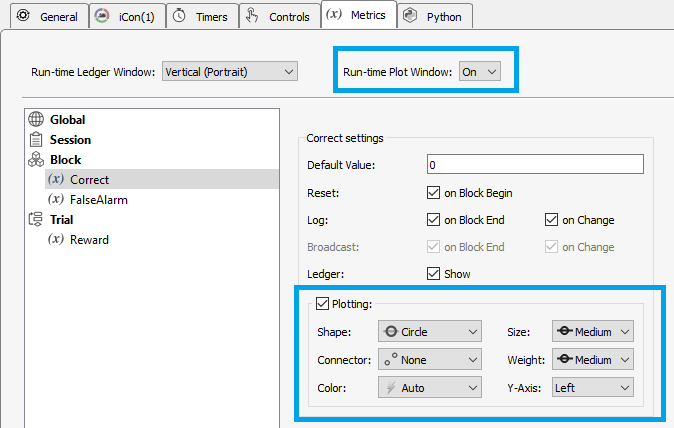 |
| Metrics Plot Option |
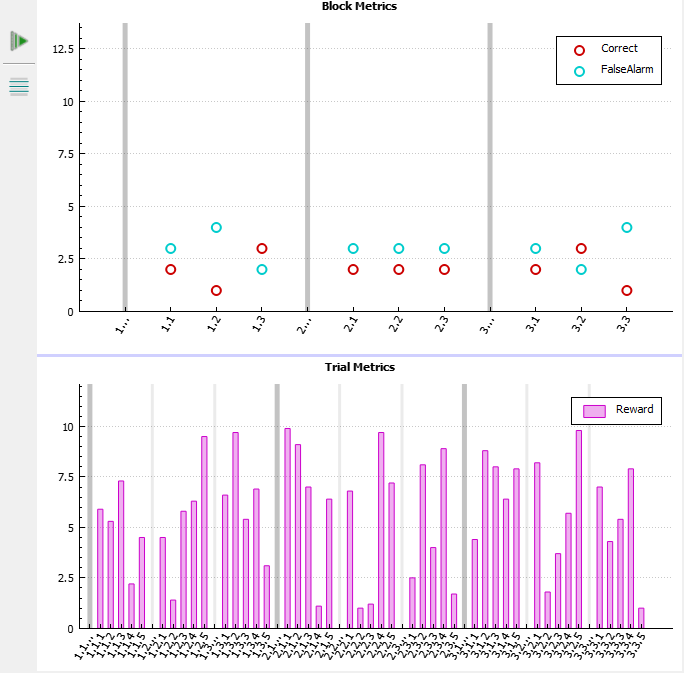
Enable Run-time Plot Window and choose the plot shape and color. Metrics are organized in the plots by their scope. Darker gray vertical bars represent new sessions. Lighter gray vertical bars represent new blocks.
If you have multiple metrics in the same scope and need two axes to represent the data
in a meaningful way, use the Y-axis Left/Right setting to plot metrics on two different
axes on the same plot. Each metric has an option to choose which of the two axes to use.
 |
| Metrics Plot Interface |


Adjusting the plots
Hover near the axis you want to change and use the mouse to change the zoom and scale. The mouse cursor will change to a vertical or horizontal axis with a finger pointed in the direction of the axis as you get near.
Left-click and drag to change the axis offset. Hold CTRL + left-click and drag, or move the mouse wheel, to change axis zoom. Here is the full list of cursors and actions:


Methods
All metric methods have the form p_Metric.{METRIC_NAME}.{METHOD}. Type p_ in the Pynapse Code Editor
and let the code completion do the work for you.
Status
read
value = p_Metric.varname.read()
Read the current value of a metric variable.
Control
write
p_Metric.varname.write(value)
Write a new value to the metric variable. This can be any python object.
inc
p_Metric.varname.inc(delta=1)
Increment the metric value by delta (default is 1).
dec
p_Metric.varname.dec(delta=1)
Decrement the metric value by delta (default is 1).
scale
p_Metric.varname.scale(sf)
Scales the metric value by sf.
round
p_Metric.varname.round(ndec)
Rounds the metric to ndec decimal places.
Data Conversion
toFloat
p_Metric.varname.toFloat()
Convert the metric value to a floating point number for math operations
toInt
p_Metric.varname.toInt()
Convert the metric value to an integer number for math operations
toString
p_Metric.varname.toFloat()
Convert the metric value to a string.
toPretty
p_Metric.varname.toPretty()
Convert the metric value to a string containing its name and value. Useful for displaying to the console
Example
p_Metric.varname.write(1)

# prints 'varname=1'
print(p_Metric.varname.toPretty())