Troubleshooting
My LEDs are not turning on
My LEDs are not turning on
Several factors affect whether the LEDs will turn on. First, check the that you have detected your Lux banks (RZ10x or iX6). Next, check that the appropriate Drivers and Sensors are active in your Fiber Photometry gizmo, and that you have the appropriate Lux bank active. Then, check the DC Offset setting in Synapse and make sure this is large enough to drive an LED. If this is still an issue, please check your connections from the RZ10x/iX6 to your photodetector and the connections from your LEDs through to your cannula.
My Fi1r signal is always very high (>9 V for PS1/PS2, >6 V for external photosensors) or a flat line at a high voltage
My Fi1r signal is always very high (>9 V for PS1/PS2, >6 V for external photosensors) or a flat line at a high voltage
If your signal is clipping on the high-end, try turning off the lights in your room. On the benchtop, ambient lighting gets picked up by the cannula and can add a lot of power to the photosensor signal. Ambient lighting will not be a problem in vivo because the brain is dark. If ambient lighting is not the cause of this issue, then adjust the power level of your LED driver down. If there is still a problem, then refer to the next FAQ point.
There is a very narrow range of LED Driver currents or Level settings that gives me a stable Fi1r signal. Outside of that, the LED is either off or I have high-end clipping.
There is a very narrow range of LED Driver currents or Level settings that gives me a stable Fi1r signal. Outside of that, the LED is either off or I have high-end clipping
The most likely issue is that too much power is going through your patchcords from the light source. Try using the PM1 to lower the current output on your LEDs to an appropriate target level, using 50 mA Max mode in the Drivers (RZ10x only).
My demodulated data stream has a steady downward slope in my subject
My demodulated data stream has a steady downward slope in my subject
You are likely experiencing bleaching or patchcord autofluorescence. One of the benefits of having an isosbestic control is that you can detrend signal bleaching in post processing using a 1st-order polyfit of the control to the GCaMP data (code in the Fiber Photometry Workbook Example). However, it is best to reduce bleaching as much as possible online. Try reducing the power of your lights first and give it a few minutes to stabilize. If that doesn't help, there may be autofluorescence in your patchcords. To reduce this, photobleach your cables.
I pick up 465 nm fluorescence on my 560 nm photosensor (crosstalk)
I pick up 465 nm fluorescence on my 560 nm photosensor (crosstalk)
This is normal due to the filter bandwidths in the fluorescent ports or Minicubes. If you are using two photosensors (one for 405 and 465 or just one for 465, one for 560) and you are modulating the LEDs at different non-multiplicative frequencies (e.g frequency parameter set to 330 Hz, 450 Hz), then this is ok, because lock-in amplification will only extract the contributions of the relevant LED driver signal on each sensor. Just make sure that the 560 photosensor is not being saturated.
My demodulated signals have low-frequency or high-frequency sinusoidal artifacts in them
My demodulated signals have low-frequency or high-frequency sinusoidal artifacts in them
If you are experiencing very fast (>2 Hz) or very low-frequency sinusoidal artifacts (<1 Hz) in one or both of your demodulated data streams, then it could be because your DC Offset is too low or your Quality-Score is too low in general. Tech Note 0991 has more information about this issue. Please read the Adjusting the LED Parameters section for more details about properly setting the DC Offset and Level.
Should I match the mV response levels of my demodulated signals? Should I run all my animals at a target mV readout?
Should I match the mV response levels of my demodulated signals? Should I run all my animals at a target mV readout?
In general, I recommend that people set the light levels (not the response levels) based on the measured light powers from a power meter instead of the mV outputs that you see in the demodulated signals. The reason for this is because there are many factors that can affect the response output (expression levels, targeting, quality of optical fibers, quality of fiber connection that session, age of animal, etc) which can change from animal to animal and even over time in the same animal. This means that a certain signal to noise is not guaranteed just by achieving a specific mV output. Also, the powers of the 405 nm and 465 nm (or whichever wavelength) LEDs are likely to be quite different if the mV output is matched. The demodulated signals get normalized in post processing anyways, so the mV response values end up not mattering too much - what matters is the relative change within each signal. Arguably the best way for someone to reproduce a recording method is to know what the light power is at the tip of the subject cable – this is especially true since different systems will do demodulation differently (or not at all in the case of CMOS cameras) and thus not even have a mV response readout that is comparable to a TDT system. From there, some people like to match the power outputs of the 405 nm and 465 nm LEDs, whereas some will run the 405 nm only as high as is needed to pick up photobleaching and motion artifact (if present). Of course, there are groups whose protocol is to match the mV response outputs. Matching the light powers is our recommendation, but you should discuss what is best for your recording protocol with other scientists and experts in the field.
I have a low Q-Score on my photosensor or power meter readings
I have a low Q-Score on my photosensor or power meter readings
Definitions about the Q-Score and practical things to keep in mind can be found in the Display Control section and the PM1 section.
In general, the Q-Score on the photosensor (when the PM1 is not in use!) is an indicator of how much return fluorescence is being picked up from the subject. A good Q-Score is around 97% and above. This means that the photosensor is clearly picking up signal at the driving frequencies of the LEDs. However, this does not necessarily mean that there is a real biological signal, because the return signal contains some autofluoresence as well. The important thing is that a high generally Q-Score means a good connection and the photosensor is working well. If you have a Q-Factor below 96% on any of your demodulated signals, then you might want to check that your LED power is high enough, that you have a good connection to the animal inside the cannula sleeve, and that your optical cables are not broken. If you run the LED power too low then the demodulated signals will mostly be noise. Check for an air gap between the fiber implant and the cable tip, and make sure that your fiber or implant are not dirty with debris (if they are, you can use a lint-free swab or microfiber cloth with 70% isopropyl alcohol to clean). The Q-Factor can also be low due to high-end clipping of the photosensor, so be sure to monitor the Fi1r signal.
Remember that the Q-Score on the photosensor should be ignored when using the PM1 because using the PM1 can cause clipping in the PS1.
Note that if you drive the 465 nm LED with a level greater than approximately 95 mA, the Q-Score for this signal may perminantly drop to 97% or less. This is a special exception to the description of low Q-Scores above, as it does not necessarily mean you have a bad signal. The Q-Score for the 465 nm LED, when driven at high levels, maxes out at 97%.
The Q-Score on the PM1 power meter indicates the quality of the signal being read during light power measurements. This number is only relevant when using the PM1. If the Q-Score is low here, then check that your DC offset is high enough (typically >5 mA). If your DC offset is 5 mA or higher, but the Q-Score is still low, then check that the optical cables you are using are not broken. If both of these check out, then please contact TDT for further investigation.
I have tried all sorts of stimuli and levels, but I cannot get a response
I have tried all sorts of stimuli and levels, but I cannot get a response
This is not an uncommon result, especially when you are getting up and running. Many factors can attribute to this, not all of which include:
Fluorophore expression - this is dependent on injection accuracy and virus uptake. Histology should be done on all subjects after the completion of experiments to verify expression.
Targeting accuracy - If the cannulas are not within approximately 1 mm of the injection site, then the ability to detect a signal will be compromised. Cannula targeting can be verified during histology.
Time since infection - Levels of GCaMP expression will decrease over time. The longer the time post infections, the lower the overall expression will be.
Photobleaching - Long-term low-level or high intensity light exposure can cause photobleaching of the GCaMP proteins. With photobleaching, users will see a decrease in response from the GFP and the response will be at a constant lower level.
Low Light Power - Under driving the LEDs can make it difficult to pick up a noticeable response during Run-Time. Try slowly increasing the light levels and retest. Do not increase the level too much, or else you may photobleach any GCaMP that is in the area.
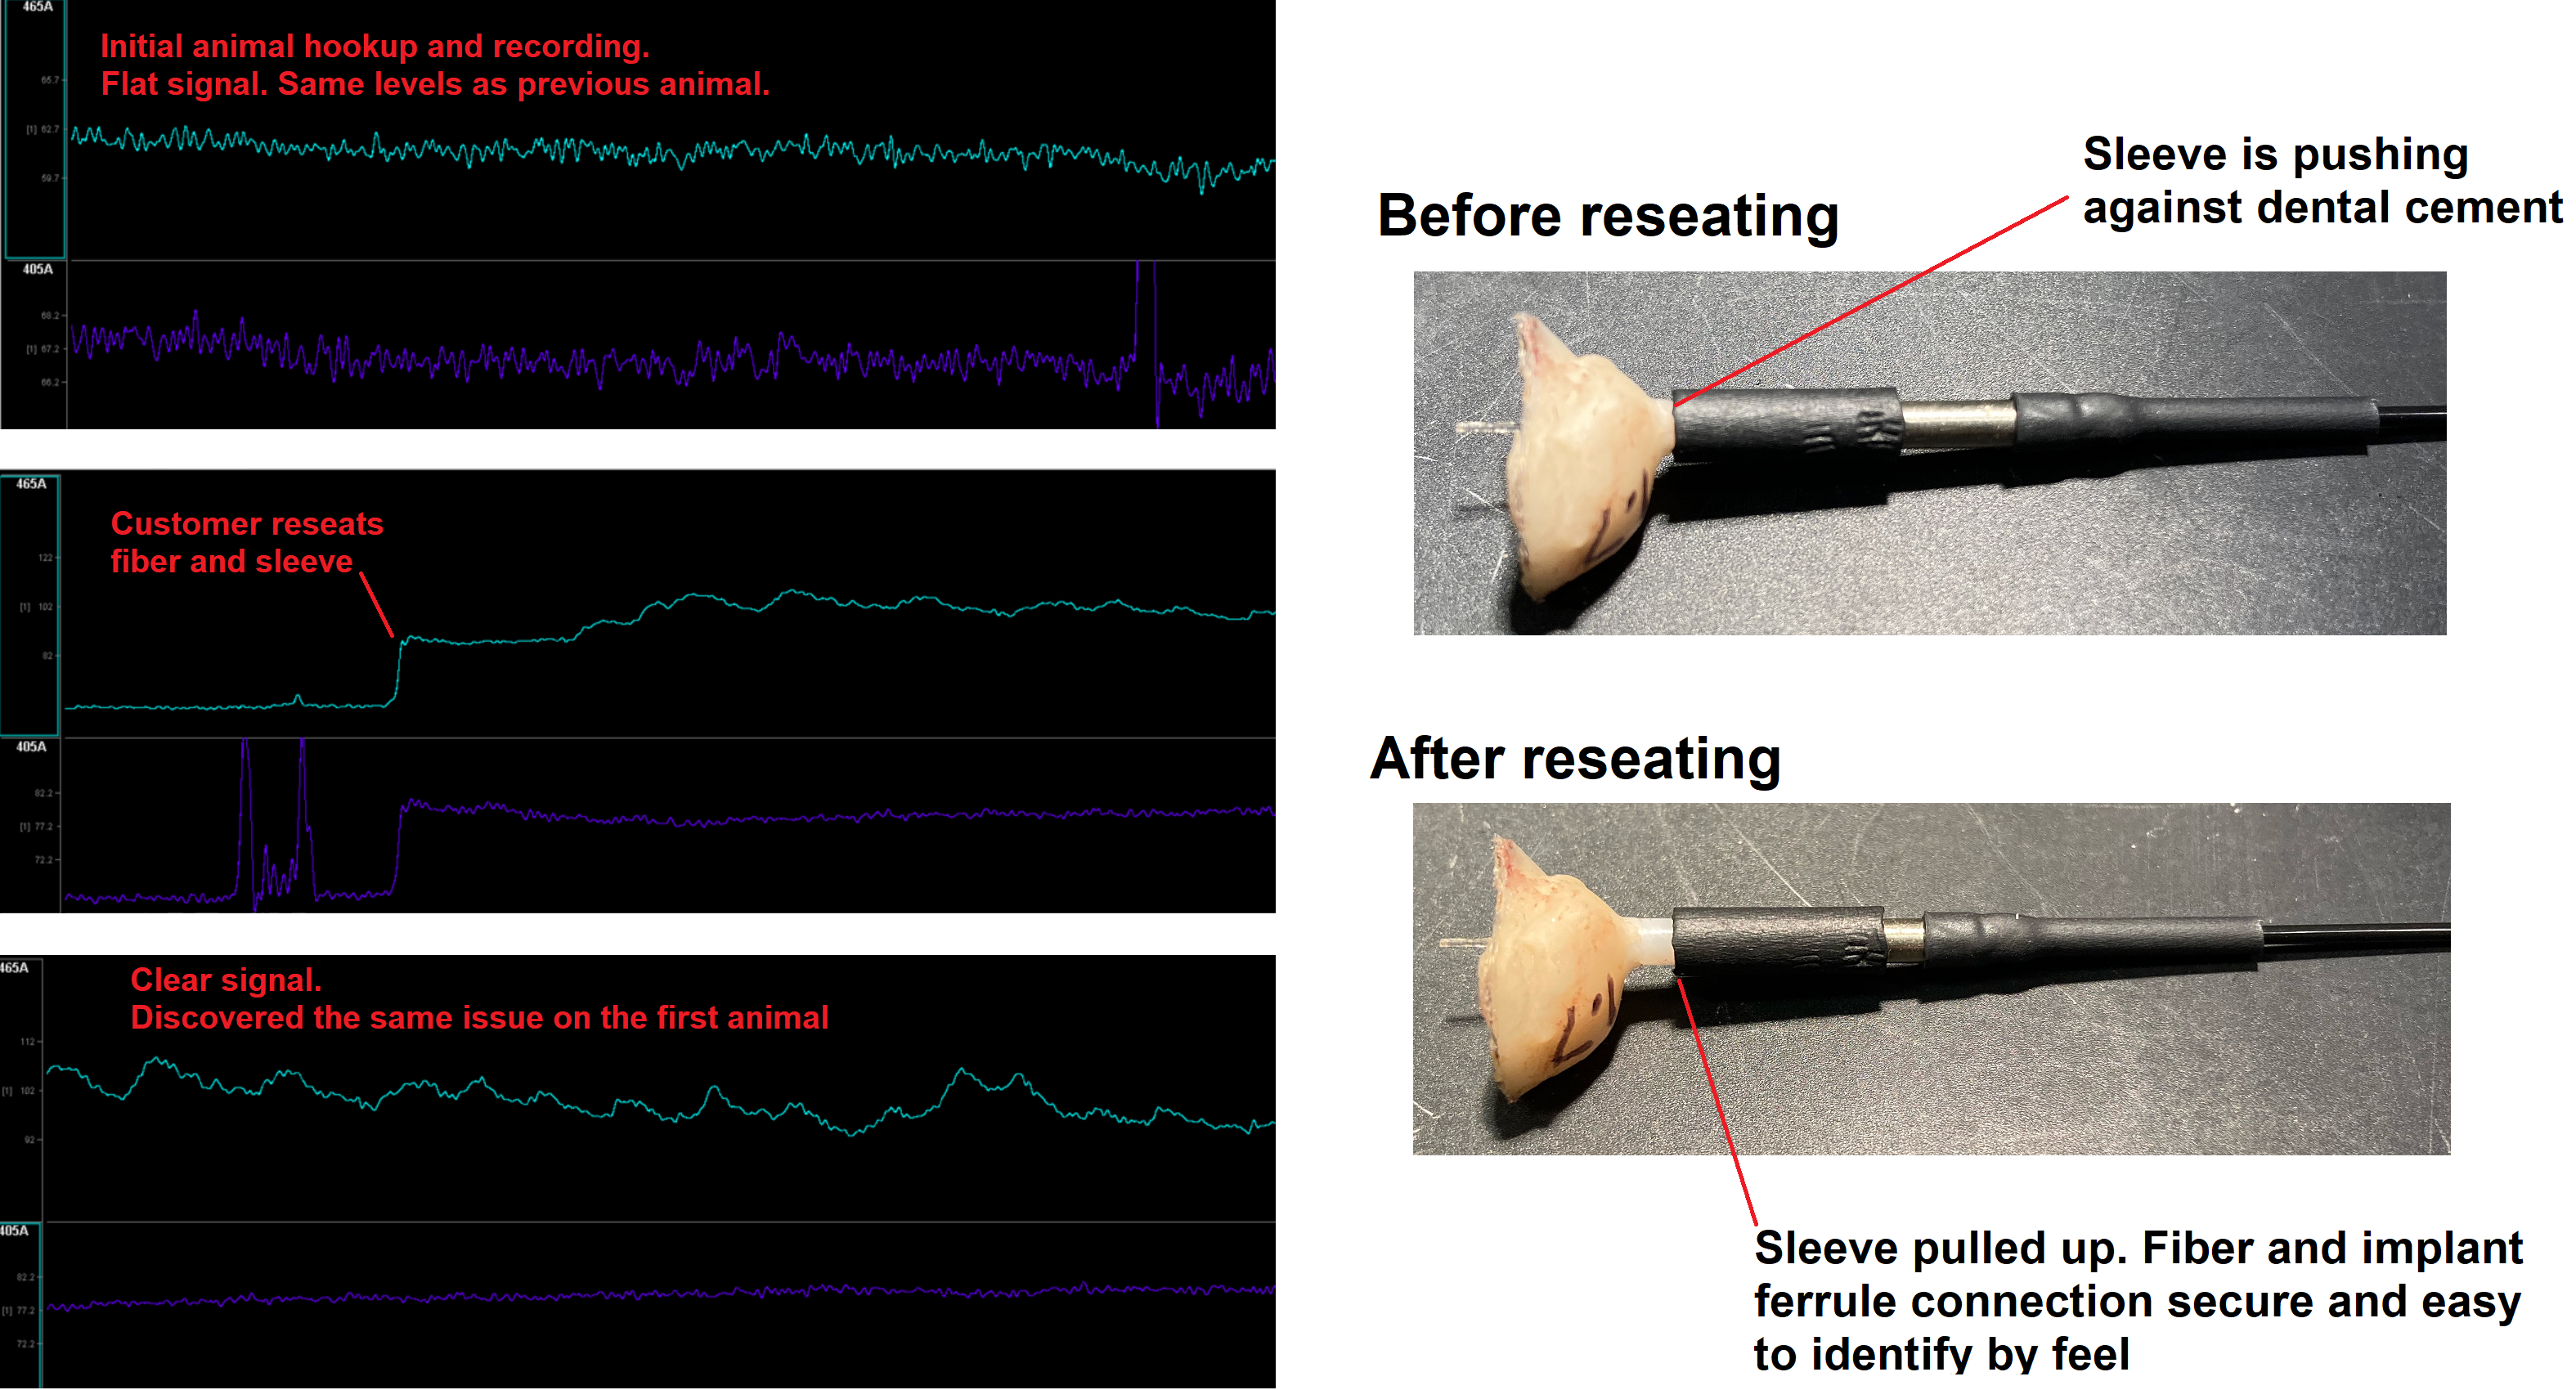
Bad Fiber Connection - It can be easy to connect the fiber to the animal and have it feel secure but not actually be making a good connection. Here is an excerpt from a troubleshooting call with a customer: the customer had hooked up two separate animals and was not seeing any signal. This was a GRAB sensor in the NAc. At first, it seemed that the ferrule was seated and secure within the sleeve. The customer said they "could not connect it any further and it felt like the two ferrules were touching each other when I twisted the connection a little bit. However, in actuality, the ferrule sleeve itself had gone all the way down the length of the exposed ferrule on the animal's head so that it was touching the cement headcap. This made it feel like it was all the way on, but there was likely dead space between the two ferrules inside the sleeve." Moving the sleeve back up helped to secure the ferrules while allowing them to meet inside. See the associated image below.
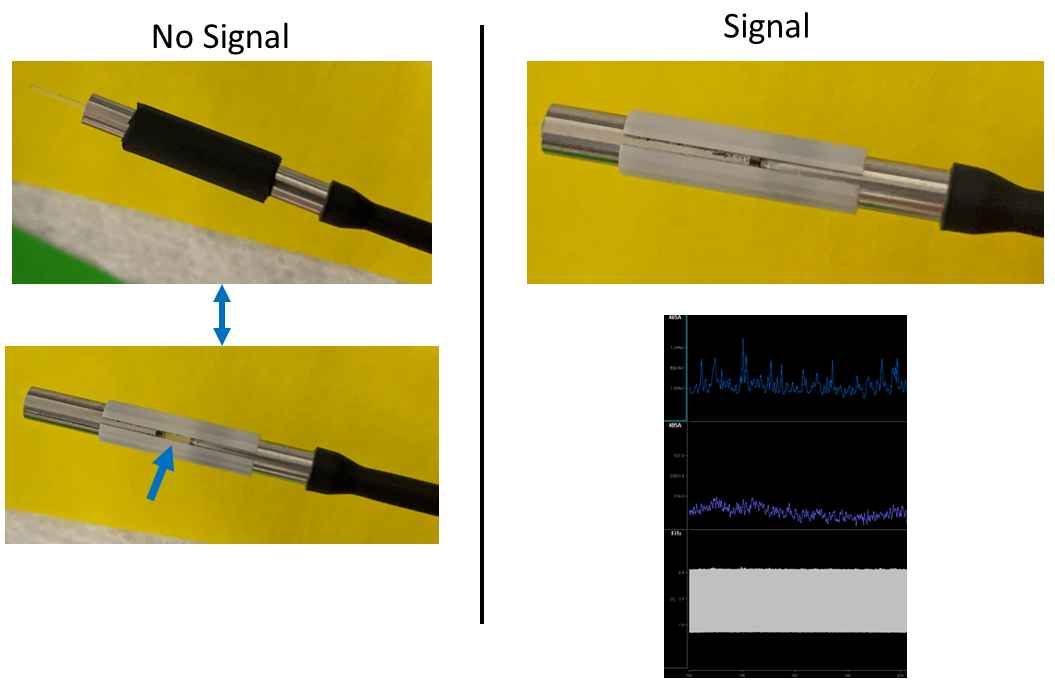
Here is another customer example: The customer was recording dLight. The first couple of animals that were hooked up had no signal (similar flat line as the no response signal in the images above). These animals used the black ferrule sleeve. There was a lot of variance in the baseline after doing several reconnects of each subject, meaning that when the fiber was removed and reconnected the baseline readout would be different. This suggested a bad connection inside the sleeve. Further, the customer said "The black covered sleeves are quite rigid and require more force than should be necessary to connect to the ferrules. This made it very difficult to determine when, or if, the fibers were touching. Connecting was also hard on the subject, as we had to restrain them and apply a lot of pressure to even get the sleeve on."
We then switched to a white ceramic which "has a clear line and allows us to visually see that the ferrules are touching. These sleeves fit snuggly but are very easy to put on and take off compared to the black coated ones." After making this switch and ensuring there was a minimal gap between the ferrule and implant, the customer was able to see a signal in their animal.
Try recording from different animals in the same cohort if you prepped multiple animals. Try multiple sleeve types, too, and make sure that there are no air gaps in the connection. If problems persist, consider trying an easier or more common target to demonstrate that the system and your methodology can work, then try targeting different areas.
What do I need to add a second animal or second site?
What do I need to add a second animal or second site?
The general rule is one photosensor and one set of dichroic mirrors or Minicube per site/subject. The RZ10x can control up to 6 independent light sources, and the iX6 can control up to 3 light sources. A two animal, fully-independent 405 nm + 465 nm setup would have: four LED Driver channels, two 405 nm and two 465 nm LEDs, two sets of proper dichroic mirrors or Minicubes, and two photosensors. Each subject would use its own Fiber Photometry gizmo and LUX bank. Multi-site setups on the same animal could share LED sources using a bifurcating cable going from the LED to each minicube or set of mirrors, but this is not recommended because you will lose independent LED and power control.
I am running two subjects but the TDT data block only saves with a single subject name. Can I have separate data/ names for each subject?
I am running two subjects but the TDT data block only saves with a single subject name. Can I have separate data/ names for each subject?
If you are running two subjects at the same time, then both recordings will save to a single file with your active subject name as the default data name (with date). There is not a way to have save the data with two unique subject IDs when you first record the data. However, there are workarounds and post-recording solutions.
You can change your subject name to include information about both subjects, but be careful about making the name too long (no more than 31 characters for the block name in total). You can use the experiment runtime notes to enter in a string of info about the animals. This will get saved in the data and in a text file in the data directory. You can also enter your own block name instead of relying on the auto name (which uses the subject ID).
If you want to separate the data, TDT offers a Windows command line tool called TankManager that lets you create new blocks from parts of other blocks. With this tool you could record both subjects to the same block and then reorganize the data after the recording however you like. For example, let's say we recorded data with two photometry gizmos from two subjects (SubA and SubB) in a block called 'BlockSplit'. You can split them as such:
from the Windows command line:
C:\Users\USERNAME> C:\TDT\Synapse\TankManager.exe --load D:\Tanks\BlockSplit-220913-145304\BlockSplit --include 405A,465A --save D:\Tanks\BlockSplit-220913-145304\BlockSplitSubjectA
and again for SubjectB:
C:\Users\USERNAME> C:\TDT\Synapse\TankManager.exe --load D:\Tanks\BlockSplit-220913-145304\BlockSplit --include 405C,465C --save D:\Tanks\BlockSplit-220913-145304\BlockSplitSubjectB
These will save copies of the data with just the included streams into new folders. Make sure to include all the data stores you want (streams and epocs). You can get a list of available store names in your block folder StoresListing.txt file.
You might get a message during the block creation that says Failed to set the system attribute on the block. It is okay to ignore this.
I want to receive digital TTL communication from an external device, such as MedAssociates. How do I do this?
I want to receive digital TTL communication from an external device, such as MedAssociates. How do I do this?
This is a common feature that customers add to their Synapse experiment when doing behavioral work.
TDT has a comprehensive digital I/O guide that you can read for a complete understanding digtial I/O communications.
The RZ10x has 24 bits of digital I/O communication. Four BNC ports are accessible on the front panel of the unit that correspond to Bits C0 - C3. Adding epoc markers to timestamp digital communication in real-time is easy in Synapse by enabling Bit Input, Word Input, or using the User Input Gizmo (v90 or greater).
The iX6 is housed in an iCon caddy, which can be expanded to include modules that send / receive digital I/O as well. This includes the iL24 for TTL communication or the iH8 or iH16 for directly interfacing with 28 V cage elements.
I want to add optogenetic or some other external TTL-triggered stimulation to my experiment
I want to add optogenetic or some other external TTL-triggered stimulation to my experiment
TDT has a comprehensive digital I/O guide that you can read for a complete understanding digtial I/O communications.
The iX6 is housed in an iCon caddy, which can be expanded to include modules that send / receive digital I/O as well. This includes the iL24 for TTL communication or the iH8 or iH16 for directly interfacing with 28 V cage elements.
The RZ10x has digital I/O BNC ports on the front panel that can be used for this.
The Pulse Gen or User Input gizmos may be used to create the pulses. Be sure to route the gizmo outputs to the desired Digital I/O port. Pulse Gen can be set up to trigger pulse trains based on gizmo inputs or external TTL inputs.
If you are wanting to use a Lux LED in one of your RZ10x rows for optogenetic stimulation, then please reach out to support@tdt.com for instructions.
Why is the sampling rate not an integer? Can I change this?
Why is the sampling rate not an integer? Can I change this?
You may have noticed that the sampling rate of your data is not a whole number. If you import your demodulated data (saved at 1017 Hz rate) you will see the Fs is 1017.25 Hz. This is okay. There is no difference between saving data at a whole number, such as 1000 Hz, or something like 1017.25 Hz. Each sample is recorded with a fixed sampling interval, which translates to a fixed time step. As long as you know how many samples are in your data stream and the exact sampling rate, you know the time of each sample.
To further explain why this is the case - the TDT sample clock is based on a 50 MHz oscillating quartz crystal. This quartz clock guarantees that all TDT processors are synchronized to the same clock sample-by-sample in real-time, and it also guarantees that all data stores can be synchronized if they are all derived from the same clock. Indeed, the store values in Synapse are integer multiples of each other: 24414.0625 Hz/24 = 1017.2526 Hz. And the 24414.0625 Hz is 50 MHz / 2048.
This real-time sample clock is a key difference in TDT products vs other manufacturers and is at the core of our guaranteed equipment synchrony. You might have to synchronize data streams post-hoc with other manufacturer's data, especially if you have multiple pieces of equipment. The sample clock also guarantees the TDT processes happen at defined expected times (i.e there is no variability in when a gizmo 'acts') and that there is quantized minimal latency throughout the process. In some manufacturer's equipment there may be variability in when a process happens because it's being controlled by a computer and not on-board DSP (digital signal processing) hardware and thus is subject to latency from the computer.
If you are asking because you want to make a time vector to match with your data array, since TDT doesn't 'save' a time array, this is straightforward. Because you know the length of your data array and the exact sampling rate, you can make a time vector by dividing the length of your data array by the sampling rate. In matlab this would look like:
time = (1:length(data.streams.STORE_NAME.data))/data.streams.STORE_NAME.fs;
Where STORE_NAME is whichever name for your continuous signal.