Data and Export
Viewing data in the BioSigRZ plots and worksheet.
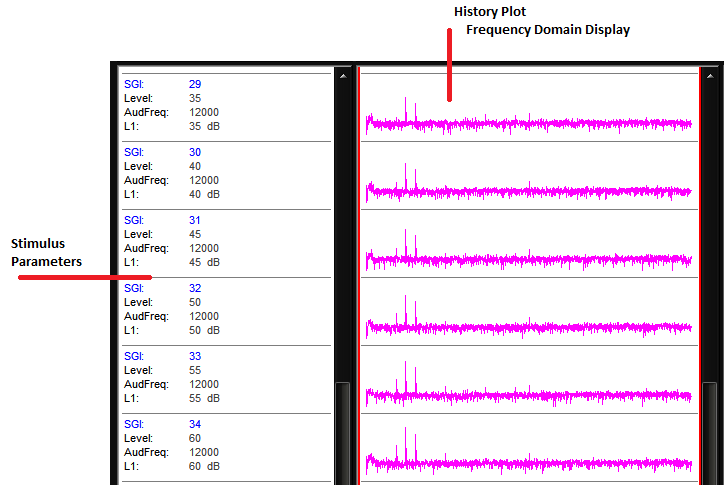
History Plot
In averaging mode, BioSigRZ acquires data and calculates a running average. Data will be acquired until enough records have been gathered to compute the final averaged signal. At that time, the averaged signal will be appended to the end of the History Plot, the SGI will be incremented, a new stimulus signal will be generated according to the current stimulus parameters, and a new average will be computed. This process continues until the termination of the stimulus schedule is reached or until you manually end data averaging. Information about each SGI is displayed to the left of the history plot (pictured below). Right-clicking this data allows you to control what data is shown.
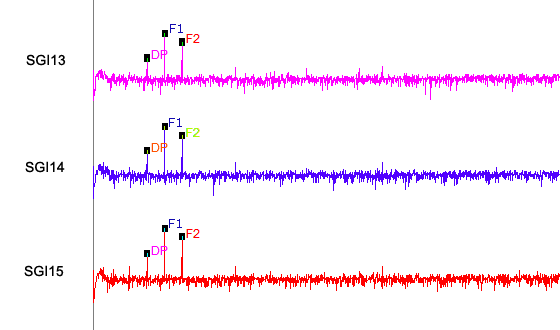
The Worksheet
The worksheet provides you with several basic functions. It allows you to graphically organize acquired data and perform mathematical and visualization manipulations of the acquired data directly in BioSigRZ. The Worksheet is located to the right of the History plot. Waveforms can be copied from the Worksheet and pasted to other applications for report writing or exported by choosing to generate a report.
To place History Plot records into the Worksheet:
-
Select the desired record(s).
-
Click and drag the selected record(s) from the History Plot to the Worksheet.
The selected History Plot record(s) will be copied to the Worksheet.
To change the token (#1) that appears to the left of the trace:
-
Right-click the worksheet.
-
The Worksheet Preferences dialog is displayed. Select the desired parameter for Token #1 from the drop-down parameter list.
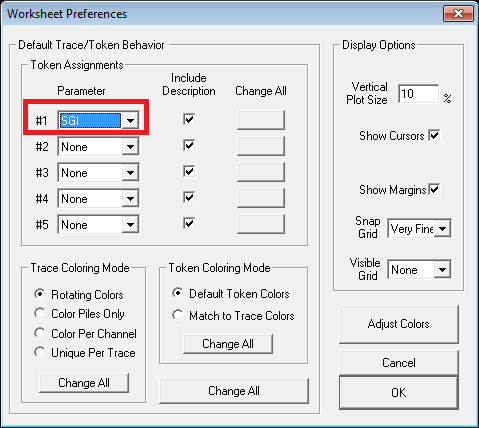
Changes made here, will be applied to records added to the worksheet after this change is made. To change existing tokens, click the Change All button to the left.
Other tokens can also be changed in this dialog.
-
Click OK, to apply the change.
For more information on using the worksheet, see the Using the Worksheet section of the BioSigRZ Manual.
Export Data
BioSigRZ has many onboard tools for viewing and working with responses. Records may be exported to a CSV (spreadsheet) file or an ASCII text file (.txt file) or you can choose to do further analysis in an environment such as Excel. We can provide support for exporting data to the desired format, but we leave further analysis up to you so that you can do it your way.
To export to CSV:
-
Select the desired records in the History plot or worksheet.
-
On the Menu bar, click the corresponding menu (History or Worksheet) and click Export to CSV file.
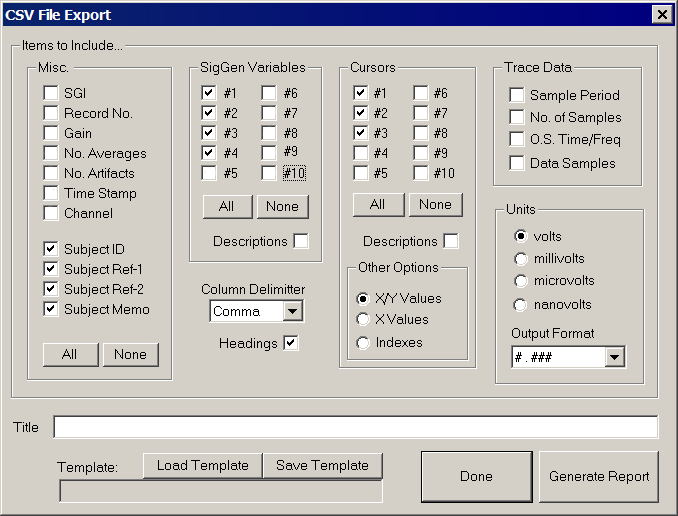
The settings shown are the typical/recommended export settings, including cursors, for DPOAEs. If you wish to further customize the export, click the check boxes or radio buttons to toggle on/off the desired options.
To export the data points that constitute each trace, check the box next to Data Samples. These data points can be used by MATLAB or Excel to recreate the exact trace shown in BioSigRZ
Type a report title in the Title field.
-
Click the Generate Report button.
-
When prompted, specify a file name and location to store the export file and click the Save button.
-
When you are returned to the CSV File Export dialog box, you can change options and generate additional report exports or click Done to exit.
Selecting Trace Data check boxes will also export the data needed to recreate the entire trace as seen in BioSigRZ.
See the BioSigRZ Manual. for further information on data viewing tools and export features.