Data Analysis
BioSigRZ provides numerous analysis functions. Using these functions you may:
-
Obtain detailed information about specific records.
-
Designate a history record for use as a comparison.
-
Perform calculations involving one or more records.
-
Build and print customized reports.
Using the History Plot and BioSigRZ Record Files
BioSigRZ's History Plot and BioSigRZ record files are central to all BioSigRZ data analysis capabilities.
The History Plot
From the History Plot, you may select records for further analysis. Signals are automatically appended to the History Plot as they are averaged. The plot can contain up to 100 records at a time.
BioSigRZ Record Files
BioSigRZ record files store averaged signals for later analysis. As signals are averaged they are appended to the currently defined BioSigRZ record file (.arf file).
Through use of the History Plot and .arf files, you may easily average, organize, store, retrieve, and analyze signal records at any time.
-
Averaged data is automatically appended to the History Plot. When the number of records exceeds 100 the earliest record is removed from the display as each new record is added.
-
Averaged data is automatically appended to the currently specified .arf file.
-
Up to 100 records may be retrieved from a specified .arf file for display in the History Plot.
-
Records may be saved to a separate .arf file.
-
Records may be saved to an ASCII text file (.txt file) or CSV (spreadsheet) file for use by other applications.
-
Records may be deleted from an .arf file.
Specifying the Current BioSigRZ Record File
Prior to averaging data, you must specify the BioSigRZ record file (.arf file) to which averaged data will be appended. You may specify the .arf file in one of two ways:
-
You may specify a default .arf file during acquisition setup.
-
You may define the current .arf file when prompted immediately prior to data acquisition.
See Defining Data Acquisition Parameters for more information.
Loading Records
BioSigRZ organizes averaged records into groups. A new group is begun each time you "Begin" data averaging and is ended each time you "End" data averaging. From the Access Record Groups dialog box, you may:
-
Retrieve groups of averaged signals.
-
Export specific groups to separate .arf files.
-
Export specific groups to ASCII text files (.txt files).
-
Delete groups of records from the .arf file.
Note
The History plot can display a maximum of 100 records at a time. Records must be displayed before they can be exported. If you need to export all records from an arf file containing more than 100 records, you must load and export it in subsets no more than 100 records long.
To prompt the Access Record Groups dialog box:
-
Select Access Record File from the History menu.
-
Specify the desired file name and click Done.
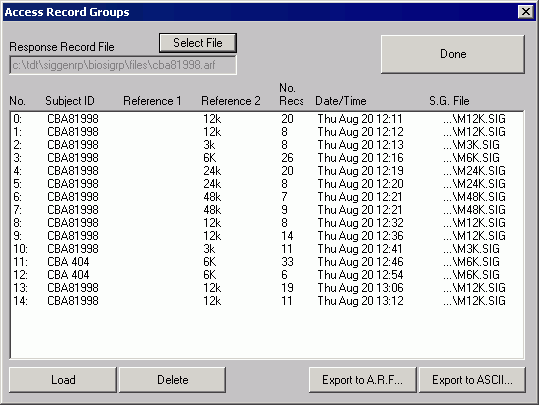
The Access Record Groups dialog box displays the following information:
No
This column displays the group number.
Subject ID
The Subject ID associated with the group of records is displayed in this column.
Reference1
This column displays the Reference 1 information assigned to the group.
Reference2
This column displays the Reference 2 information assigned to the group.
No. Recs
The number of records in the group is displayed in this column.
Date/Time
This column displays the date and time the group of records was acquired.
S.G. File
The S.G. File column displays the name of the SigGenRZ file used to generate the stimulus signal.
Selecting Groups
Windows provides standard procedures for selecting/deselecting groups. You may use these procedures to select groups from the Access Record Groups dialog box.
To deselect all groups:
- Click the Deselect All button.
Performing Actions
Groups may be loaded into the History Plot, deleted from the .arf file, exported to another .arf file, or exported to an ASCII text file (.txt file) or CSV (spreadsheet) file.
To load, delete, or export a group of records:
-
Select the desired groups.
-
Click the appropriate button.
If the chosen action is Load, then you will see the Select Records to Load dialog box.
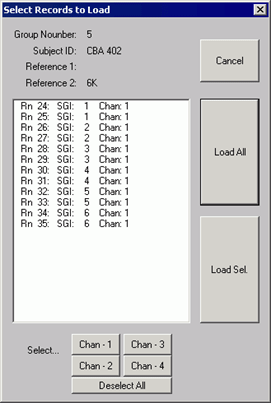
- Select the record(s) you wish to load and click Load Sel. Or load all the records by clicking Load All. You may manually select/deselect records for loading or you may use the Select buttons to automatically select/deselect records.
If the chosen action is Delete, you will be prompted "Are you sure?"
- Answer Yes to delete the selected groups from the file. The Access Record Groups dialog box will remain open.
If the chosen action is an export, you will be asked to supply the export file name. The selected groups will be saved to the designated file. The Access Record Groups dialog box will remain open.
Access Another BioSigRZ Record File
To access another BioSigRZ Record File:
-
Click the Select File button.
-
Select the desired file.
Closing the Load Record Group Dialog Box
To close the Load Record Group dialog box:
- Click the Done button.
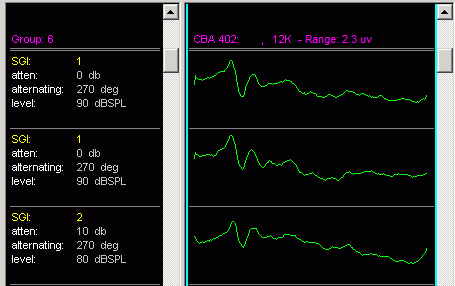
The History Plot
Customizing History Info
You may customize the information displayed in the History Info area.
To customize the History Info area:
- Click the right mouse button in the History Info area.
You will see the Info-Bar Setup dialog box.
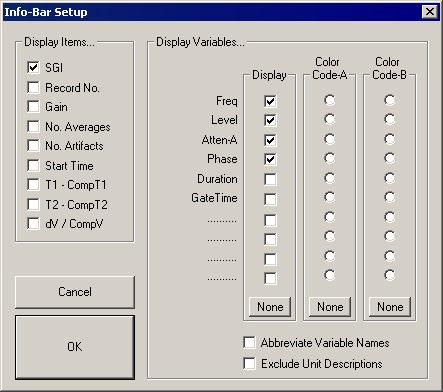
From this box you may specify items to be displayed in the History Info area. You may also associate a group color with a particular variable. Group colors are created from the General Display Options dialog box. See Customizing Your Display for more information.
Display Items
From the Display Item group box, you may specify all information to be displayed in the History Info area. Display items consist of the following:
-
SGI: The current SigGen Index.
-
Record No: The current record number.
-
Gain: The gain as currently defined in the Acquisition Setup dialog box.
-
No. Averages: The number of signals from which the average was calculated.
-
No. Artifacts: The total number of signals discarded due to artifact rejection.
-
Start Time: The start time of data acquisition.
-
T1 - CompT1: The difference in milliseconds between Cursor 1 of the current record and Cursor 1 of the Comparison record.
-
T2 - CompT2: The difference in milliseconds between Cursor 2 of the current record and Cursor 2 of the Comparison record.
-
dV/CompV: Delta V percentage calculated as follows:
*V of the current record / *V of the Comparison record * 100
To select information for display in the History Info area:
- Check the desired box (you may check multiple boxes).
Display Variables:
You may specify which, if any, variables you wish to display. Chosen variable names and current variable values will be displayed for each record in the History Plot. You may also assign a color to a variable. Finally, you may customize the variable display by abbreviating the variable names or excluding the unit description (e.g., ms, Hz, dB).
To select variables for display in the History Info area:
- Check the desired box (you may check multiple boxes).
To assign a color to a variable:
-
Create the desired Group Color (A or B) from the General Display Options dialog box.
-
Check the desired color, Code-A or Code-B.
To abbreviate variable names:
- Check the Abbreviate Variable Names check box. All variable names will be abbreviated.
To exclude unit descriptions:
- Check the Exclude Unit Descriptions check box. All unit descriptions will be excluded.
Exporting History Plot Records
Groups of records can be reorganized through use of the Load Record Group dialog box. Individual records can be reorganized through use of the History Plot.
Individual History Plot records may be exported to another .arf file or exported to an ASCII text file (.txt file) or CSV spreadsheet file.
To export History Plot records:
-
Select the desired records.
-
Select the desired export action from the History menu.
-
If Export to ARF file is selected supply the file name and click Open to save the file.
-
If Export to ASCII file is selected supply the file name and click Open to save the file.
-
If Export to CSV is selected, the CSV File Export dialog is prompted.
-
CSV File Export Dialog
The Export to CSV option allows you to export raw trace data along with descriptions into a standard spreadsheet file. Each row in the spreadsheet file contains all of the data for one record.
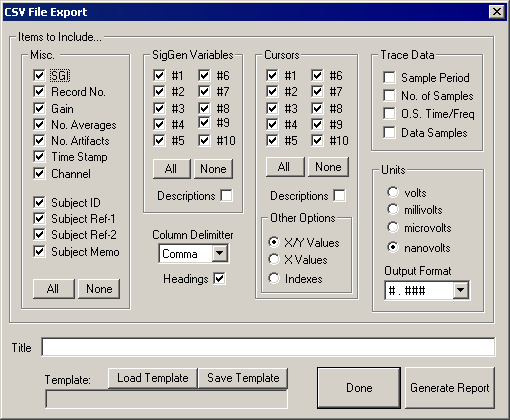
Selecting Items
You may select one or more miscellaneous item, SigGen variable, or cursor.
To select individual items:
- Check the appropriate box.
To select all items within a box:
- Click the All button.
To deselect all items within a box:
- Click the None button.
Misc. and SigGen Variables
Saves the selected fields to the spreadsheet file.
Cursors
X/Y Values
Exports both X and Y values for cursors.
X Values
Exports only X values for cursors. Does not export Y values.
Indexes
Exports the indices of the cursors. This indicates which sample in the waveform the cursor was located on.
Trace Data
Sample Period
Sampling period in microseconds of the acquired data.
No. of Samples
Number of samples in the trace.
O.S. Time/Freq
Offset of the first point in waveform in ms for Time or Hz for Frequency.
Data Samples
Saves the data for the waveform.
Units
Scales the output to the units that are selected. For example, a cursor value that is .0001 V will be output as 100.0 uV if microvolts are selected.
Output Format
Sets the output format of the data. For example #.### will export data to three decimal places.
Template
Saves the export settings from the CSV File Export dialog box to a file that can be reloaded later.
Report Name
You must specify how the report is to be formatted. Additionally, you may give the report a title.
To define a title:
- Enter the title in the Title field.
Generating the Report
To generate the report:
- Click the Generate Report button.
Making a Comparison Record
BioSigRZ allows you to choose a record for comparison with other data records. Any record currently displayed in the History Plot may be used as a comparison record.
The comparison record may be displayed in the Cursor Edit window. This window is explained in greater detail in the following section Viewing Records in Detail. The comparison record may also be displayed in the Multi-Purpose Plot during data acquisition.
To make a comparison record:
-
Click the desired record.
-
Select Toggle Comparison from the History menu or Ctrl+Double-click the desired record.
To display a comparison record in the Multi-Purpose Plot:
-
Select Show Comparison from the Multi-Plot menu.
-
Select Running Average from the Multi-Plot menu.
The comparison record will be displayed along with the running average.
Viewing Records in Detail
You may wish to view individual history records in greater detail. From the Cursor Edit window, you can:
-
View a more detailed plot of the time-domain waveform.
-
View frequency-domain information.
-
View subject information.
-
Place cursors to obtain intensity and time information.
-
View information pertaining to the SGI.
To access the Cursor Edit window:
- Double-click the desired history plot record.
or
-
Click the desired history plot record and select Edit Cursors from the History menu.
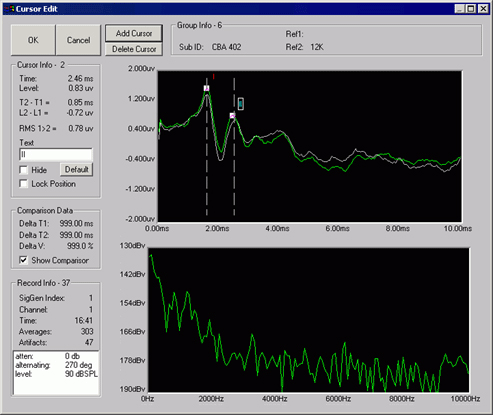
Time-Domain Plot
The Cursor Edit window contains two waveform plots. The upper plot displays the time-domain waveform. The x-axis is labeled in units of time. The y-axis is labeled in Volts.
Using Zoom
You may zoom-in on a portion of the time-domain waveform.
To zoom-in on a portion of the time-domain waveform:
-
Place the mouse pointer at the beginning of the zoom area.
-
Hold down the left mouse button.
-
Drag the mouse pointer to the end of the zoom area.
-
Release the left mouse button.
-
Repeat for additional zoom.
To return to the original time-domain waveform:
- Click the right mouse button anywhere in the Time-Domain Plot.
Frequency-Domain Plot
BioSigRZ performs a Fast Fourier Transform (FFT) on the waveform displayed in the Time-Domain Plot. The resulting frequency-domain waveform is displayed in the lower plot on the BioSig Cursor Edit window. The x-axis is labeled in Hz. The y-axis is labeled in dB Volts.
Using Zoom
You may zoom-in on a portion of the frequency-domain waveform.
To zoom-in on a portion of the frequency-domain waveform:
-
Place the mouse pointer at the beginning of the zoom area.
-
Hold down the left mouse button.
-
Drag the mouse pointer to the end of the zoom area.
-
Release the left mouse button.
-
Repeat for additional zoom.
To return to the original frequency-domain waveform:
- Click the right mouse button anywhere in the Frequency-Domain Plot.
Subject Information
Subject information is displayed in the Group Info group box. This box displays the following information:
Group Info
Each time you initiate Averaging mode by choosing Begin, a new data group is created and appended to the end of the BioSig record file (.arf file) and to the end of the History Plot. Groups are numbered sequentially. The Group Info title displays the group number of the current record.
Subject ID
This read-only field displays the subject ID that you assigned during the initiation of Averaging mode.
Ref1 and Ref2
These read-only fields display other subject data that you assigned during the initiation of Averaging mode.
Memo
This read-only field displays any additional text information that you assigned during the initiation of Averaging mode.
Cursors
You may place up to 10 cursors in the Time-Domain Plot. Cursors may be used to obtain specific information concerning:
-
Level at a specific point
-
Time at a specific point
-
Change in time (T) between two points
-
Change in voltage (V) between two points
Working with Cursors
Cursors may be manipulated in various ways.
To place a cursor in the Time-domain Plot:
- Double-click the desired position.
or
-
Click the Add Cursor button.
-
Move the cursor to the desired position.
Note
Placing a cursor is more precise if you first zoom-in on a portion of the signal.
To move a cursor:
-
Place the mouse above the cursor.
-
Hold down the left mouse button.
-
Drag to the desired position.
Note
Moving a cursor to a new position is more precise if you first zoom-in on a portion of the signal.
To select a cursor:
-
Click the cursor.
-
The selected cursor text appears surrounded by a small box.
To delete a cursor:
-
Select the desired cursor.
-
Click the Delete Cursor button.
Cursor Info
Information about the selected cursor is displayed in the Cursor Info group box.
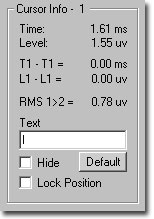
The title of the Cursor Info group box displays the number of the currently selected cursor.
Time
The Time field displays the time value associated with the currently selected cursor.
Level
The Level field displays the instantaneous intensity level associated with the currently selected cursor.
Tn - T1
This field displays the difference in time (T) between the selected cursor (Cursor n) and Cursor 1.
Ln - L1
This field displays the difference in intensity (L) between the selected cursor (Cursor n) and Cursor 1.
RMS 1>2
This field displays the RMS amplitude as calculated between cursors 1 and 2.
Text
The text field displays the label associated with the currently selected cursor. You may edit this label.
To edit the cursor label:
-
Type the desired text in the Text field.
-
Click the cursor.
The cursor label will be updated.
To move the cursor label relative to the cursor:
-
Place the mouse pointer over the desired label.
-
Hold down the left mouse button and drag the label to the desired position.
-
Release the left mouse button.
Default
Clicking the Default button causes the label of the currently selected cursor to return to its default setting.
Hide
Checking this box hides the label of the currently selected cursor.
Lock Position
You may lock the position of the currently selected cursor by checking the Lock Position box.
Comparison Data
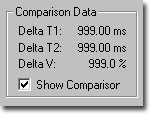
Information about the relationship of the current record to the comparison record is displayed in the Comparison Data group box.
To display the comparison record:
- Check the Show Comparison checkbox.
The comparison record will be displayed in the Time-domain plot along with the current record. The location of cursors in the comparison plot will be displayed with vertical dashed lines.
Delta T1
This field displays the difference in time between Cursor 1 of the current record and the comparison record.
Delta T2
This field displays the difference in time between Cursor 2 of the current record and the comparison record.
Delta V
This field displays a percentage value computed as follows:
*V of the current record / *V of the Comparison record * 100
Record Information
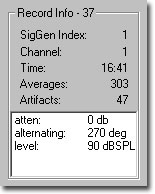
Information about the current record is displayed in the Record Info group box.
SigGen Index
The SGI associated with the current record is displayed in the SigGen Index field.
Channel
The current channel is displayed in the Channel field.
Time
The duration of the record is displayed in the Time field.
Averages
The number of sweeps included in the average is displayed in the Averages field.
Artifacts
The number of responses discarded due to artifact rejection is displayed in the Artifacts field.
Variables
The Variables box contains a list of all signal variables and their current values.
Using the Worksheet
You may use the Worksheet to set aside records for mathematical operation or to build and print reports. The process is simple and straightforward.
-
Place all desired History Plot records into the Worksheet.
-
Format tokens and traces.
-
Select records in the Worksheet for mathematical operations.
-
Perform mathematical operations using the Calculator.
-
View Worksheet records in detail.
-
Organize the report.
-
Print the report.
Placing Records
To place History Plot records into the Worksheet:
-
Select the desired record(s).
-
Select To Worksheet from the History menu. A box appears in the Worksheet.
-
Move the box to the desired location.
-
Click the left mouse button.
or
-
Select the desired record(s).
-
Drag the selected record(s) from the History Plot to the Worksheet.
The selected History Plot record(s) will be placed into the Worksheet.
Formatting Tokens and Traces
You may customize the following:
-
The general worksheet area
-
Specific tokens
-
Specific traces
Customizing the General Worksheet
You may customize the Worksheet area from the Worksheet Preferences dialog box. This dialog box controls the default behavior of the Worksheet.
To access the Worksheet Preferences dialog box:
-
Click the right mouse button anywhere in the Worksheet, but not directly above a trace or a token.
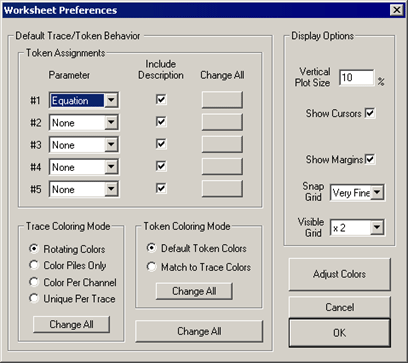
The Worksheet Preferences dialog box is divided into two sections:
-
Default Trace/Token Behavior
-
Display Options
Preference settings located within the Default Trace/Token Behavior section affect trace or token parameters. These Worksheet preferences affect all records subsequently placed into the Worksheet. You can override these settings by specifically customizing tokens and traces as described in the Customizing Specific Tokens section below.
Parameter settings located in the Display Options section affect the Worksheet as a whole.
Token Assignments
You may assign up to five tokens for each Worksheet record. Tokens may consist of a variety of parameters.
Parameter: Token Assignment parameters may be selected from the Parameter list boxes found in the Token Assignments group box.
Include Description: Token Assignment parameters consist of a description and a number. For example, Channel and Record No. consist of a description (Chan: and Rn:, respectively) followed by a number. By default, all token descriptions are displayed. You may choose to omit the description from the Worksheet display. To do so, simply uncheck the appropriate Include Description check box.
Trace Coloring Mode
You may wish to enhance the Worksheet display through the application of trace color. You may choose one of the following Trace Coloring Modes:
Rotating Colors: Causes trace colors to rotate. Rotating colors are assigned based on the Trace colors you defined in the Worksheet Display Options dialog box.
Color Piles Only: Assigns the same color to all records stacked in the same pile.
Color Per Channel: Assigns unique trace colors for each channel.
Unique Per Trace: Assigns a unique color to each trace.
Token Coloring Mode
Token color may be assigned the following ways:
Default Token Colors: Assigns the token colors you defined in the Worksheet Display Options dialog box.
Match to Trace Color: Overrides the default token color and assigns the color of the associated trace.
Display Options
You may control the look of the overall Worksheet display by specifying the following:
Vertical Plot Size: Controls the vertical dimension of the plot.
Show Cursors: Displays any cursors placed in the record.
Show Margins: Shows/hides the margin lines used to separate Worksheet sections.
Snap Grid: Controls the fineness of the Snap-to-Grid. This is the invisible grid onto which all Worksheet objects snap into place.
Visible Grid: Controls the visible grid. You may choose no grid or control the resolution of the visible grid.
Adjust Colors
From the Adjust Colors button, you may modify color settings through the Worksheet Display Options dialog box.
Change All
Token and Trace preferences affect all records subsequently placed into the Worksheet. If you wish to change these preferences for records currently displayed in the Worksheet, you must click the appropriate Change All button.
Local Change All Buttons
You may modify existing Worksheet record parameters individually by clicking the appropriate "local" Change All button. Local Change All buttons are provided for the following:
-
Token Assignment parameters
-
Trace Coloring Mode settings
-
Token Coloring Mode settings
Global Change All
You may modify existing Worksheet record parameters as a group by clicking the global Change All button. The Global Change All button simultaneously updates all parameters located in the Default Trace/Token Behavior section.
Customizing Specific Tokens
To customize a specific token:
- Click the right mouse button on the desired token.
You will see the Token Options dialog box. From here you can modify the token, position the token, change its text, or cause it to be hidden.
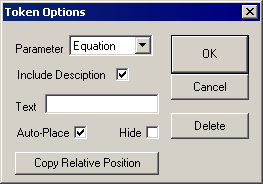
Parameter and Include Description
You may change the Parameter and show/hide the token description. For more information, see Customizing the General Worksheet.
Text
You may customize the token by entering the desired text in this field. Note: To change a token's text you must first choose User Text from the Parameter list.
Auto-Place
Realigns the token with its trace.
Hide
Hides the token.
Copy Relative Position
Copies the position of the token relative to its trace to all other traces and tokens.
Delete
Deletes the token.
Customizing Specific Traces
To customize a specific trace:
- Click the right mouse button on the desired trace.
You will see the Response Trace Options dialog box. From here you can modify the trace color, position the trace, edit its token, delete the trace, or cause its tokens to be hidden.
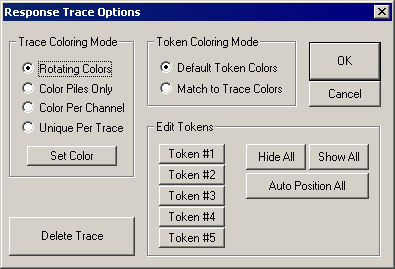
Trace Coloring Mode and Token Coloring Mode
You may set the Trace or Token coloring modes. For more information see the previous section, Customizing the General Worksheet.
Set Color
This button accesses the Color dialog box, from which you may set custom colors.
Edit Tokens
You may edit the tokens associated with a specific trace. Clicking the desired token button opens the Token Options dialog box (see previous section).
Hide All
Hides all tokens associated with the current trace.
Show All
Shows all tokens associated with the current trace.
Auto Position All
Realigns all associated tokens with the current trace.
Delete Trace
Deletes the current trace.
Selecting Worksheet Records
Various Calculator and Worksheet formatting functions require the selection of one or more record.
To select specific records:
- Ctrl+Click the desired trace(s). The record's token will appear in reverse color.
Note
You must Ctrl+Click the trace. A Ctrl+Click on the token will not select the record.
To select all records:
- Select Select All from the Worksheet menu or press the Spacebar.
To select contiguous records:
-
Hold down Ctrl and the left mouse button.
-
Drag until the box surrounds all desired records.
-
Release the left mouse button and the Ctrl key.
To deselect specific records:
- Ctrl+Click the desired selected trace(s).
Note
You must Ctrl+Click the trace. A Ctrl+Click on the token will not deselect the record.
To deselect all records:
- Select Deselect All from the Worksheet menu or press Ctrl+Space bar.
Performing Mathematical Operations
You may perform a variety of mathematical operations on Worksheet records. These operations are described in detail in Using the Calculator.
To perform a mathematical operation:
-
Select the desired Worksheet record(s).
-
Click the appropriate Calculator button.
or
- Select the appropriate Calculator menu option.
Viewing Worksheet Records in Detail
You may view a worksheet record in detail from the BioSig Cursor Edit dialog box.
To access the BioSigRZ Cursor Edit dialog box:
- Double-click the desired Worksheet record.
Organizing the Report
Moving a Record
You may move individual records. Moving a record moves both the trace and all associated tokens.
To move a record:
-
Place the mouse pointer over the trace.
-
Hold down the left mouse button.
-
Drag the record to the desired position.
-
Release the mouse button.
Note
You must place the mouse pointer over the trace. Placing the mouse pointer over the token will move the token only.
To move a group of records:
-
Select the desired records.
-
Place the mouse pointer over a selected trace.
-
Hold down the left mouse button.
-
Drag the records to the desired position.
-
Release the mouse button.
Note
Selected records always move as a block. If you wish to move only one record of a selected block, deselect the record, move it, and then re-select the record.
Moving a Token
You may wish to move a token relative to its associated trace.
To move a token:
-
Place the mouse pointer over the token.
-
Hold down the left mouse button.
-
Drag the token to the desired position.
-
Release the mouse button.
Using the Worksheet Buttons
Located below the Calculator, the five Worksheet buttons can be used to format and organize the Worksheet. These functions may also be found in the Worksheet menu.


BioSigRZ provides the standard Windows functions: Print Setup, Print Preview, and Print.
To setup the printer:
- Select Print Setup from the File menu.
To preview the Worksheet:
- Select Print Preview from the File menu.
To print the Worksheet:
- Select Print from the File menu.
Exporting Worksheet Records
All Worksheet data may be saved to an ASCII or CSV file. Such data can be accessed by other applications.
To export Worksheet records:
-
Select the desired records.
-
Select the desired export action from the Worksheet menu.
-
If Export to Ascii is selected you will be asked if you wish to include detailed group information (additional information such as the .sig file names, number of records, subject ID, reference and memos).
Supply the file name and click Open to save the file.
-
If Export to CSV is selected, the CSV File Export dialog is prompted. See CSV File Export Dialog for more information.
-
Saving and Opening Worksheet Files
Reports may be saved in BioSigRZ Worksheet files. The extension for these files is .awf.
Saving BioSigRZ Worksheet Files
To save a new BioSigRZ Worksheet file:
- Select Save Worksheet As from the Worksheet menu.
The Save As dialog box will be displayed. You may assign a name to your new signal.
To save an existing file:
- Select Save Worksheet from the Worksheet menu.
The file will be saved with its current name.
Opening BioSigRZ Worksheet Files
To open a BioSigRZ worksheet file:
-
Select Open Worksheet from the Worksheet menu or click the Worksheet Records
 button
 -
Click on the desired file
-
Click Open
Using the Calculator
The calculator provides numerous mathematical functions that may be applied to one or more Worksheet records.
Calculator Functions
-
Scale
-
Invert Trace
-
Shift Baseline
-
Remove Baseline
-
Zero Points
-
Crop
-
Add
-
Subtract
-
Average
-
Time Align
-
Time Shift
-
Smooth
-
Lowpass Filter
-
Highpass Filter
-
Bandpass Filter
-
Notch Filter
-
Hanning Window
-
Cosine^2 Window
-
Mag Spectrum
Scale
The Scale function multiples each point in the selected Worksheet record(s) by a user-defined constant. This function may be used to increase or decrease the scale of a waveform displayed in the Worksheet. By specifying a negative scale factor, you may also invert the selected Worksheet record(s).
To scale a Worksheet record:
-
Select the desired record(s).
-
Click

or
- Select Scale from the Calculator menu.
You will be prompted to enter the desired scale factor. This factor must be no less than -(1010) and no greater than 1010.
Invert Trace
Invert Trace multiplies each point in the selected Worksheet record(s) by -1, thereby inverting the waveform while maintaining its original scale.
To invert a Worksheet record:
-
Select the desired record(s).
-
Click

or
- Select Invert Trace from the Calculator menu.
Shift Baseline
The Shift Baseline function adds a user-defined constant, or DC offset, to each point in the selected records(s), effectively shifting the baseline.
To add a DC offset to a Worksheet record:
-
Select the desired record(s).
-
Click

or
- Select Shift Baseline from the Calculator menu.
You will be prompted to enter the DC offset. This offset must be no less than -1000 microvolts and no greater than 1000 microvolts.
Remove Baseline
A DC offset may be removed through the use of Remove Baseline.
To remove a DC offset from a Worksheet record:
-
Select the desired record(s).
-
Click

or
- Select Remove Baseline from the Calculator menu.
Zero Points
The Zero Points function allows you to "zero out" a specific portion of a Worksheet record. Zero Points will convert each point within the specified time range to a value of zero.
To zero a portion of the record:
-
Select the desired record(s).
-
Click

or
- Select Zero Points from the Calculator menu.
You must specify the time interval within which you wish to convert all level values to zero. You will be prompted to enter a lower time boundary and an upper time boundary.
Add
The Add function adds two or more Worksheet records.
To add Worksheet records:
-
Select two or more records.
-
Click

or
-
Select Add from the Calculator menu. A box appears in the Worksheet.
-
Move the box to the desired location.
-
Click the left mouse button. The resulting record will be added to the Worksheet.
Subtract
The Subtract function allows you to subtract one Worksheet record from another.
To subtract one Worksheet record from another:
-
Select the record from which you wish to subtract.
-
Select the record you wish to subtract.
-
Click

or
-
Select Subtract from the Calculator menu. A box appears in the Worksheet.
-
Move the box to the desired location.
-
Click the left mouse button. The resulting record will be added to the Worksheet.
Average
The Average function calculates the average of two or more records.
To average Worksheet records:
-
Select two or more records.
-
Click

or
-
Select Average from the Calculator menu. A box appears in the Worksheet.
-
Move the box to the desired location.
-
Click the left mouse button. The resulting record will be added to the Worksheet.
Time Align
The Time Align function lines up two or more records according to values on the time axis. Records will be aligned with the first selected record of the group.
To time align Worksheet records:
-
Select two or more records.
-
Click

or
- Select Time Align from the Calculator menu. The records will be aligned in time.
Time Shift
The Time Shift function shifts the selected record(s) along the time axis.
To time shift Worksheet records:
-
Select the desired record(s).
-
Click

or
- Select Time Shift from the Calculator menu.
You will be prompted to enter the amount of time shift in milliseconds. This number can be no less than -100 ms and no greater than 100 ms.
Note
Once data points have been time-shifted off the Worksheet display, they cannot be retrieved. These points in effect no longer exist. All such points will appear as zero.
Smooth
The Smooth function smoothes a selected Worksheet through application of an averaging algorithm. The record is averaged with a shifted version of itself.
To smooth a Worksheet record:
-
Select the desired record(s).
-
Click

or
- Select Smooth from the Calculator menu.
You will be prompted to enter the number of smooth points. This is the number of points to be included in the average. For example, specification of 2 smooth points will cause the record to be average with a second version of itself shifted by one point. Specification of 3 smooth points will result in an average based on the original record, a version of the record shifted by one point, and a version of the record shifted by two points.
The resulting record will be added to the Worksheet.
Filtering
BioSig provides functions allowing you to lowpass, highpass, bandpass filter, or notch filter Worksheet records. BioSig performs filtering through use of a Butterworth filter.
In order to specify a filter, you must define certain filter parameters. These parameters include:
-
Corner frequency: Frequency at which the level has decreased by 3 dB.
-
Center frequency: The center frequency of a bandpass filter.
-
Filter Bandwidth: The bandwidth between lower and upper corner frequencies of a bandpass filter. Filter bandwidth is defined in octaves. Filter bandwidth must be at least 0.01 octave and no greater than 10 octaves.
-
Filter order: The number of poles necessary to achieve a desired roll-off rate. Roll-off rate = 6 dB per octave per pole. Number of poles must be an even number. Number of poles must be at least 2 and no greater than 20.
Example: Specifying a Filter
You may wish to specify a lowpass filter with a -3 dB frequency of 4000 Hz and a roll-off of 120 dB per octave.
You would define the following parameters:
Corner frequency = 4000 Hz
Filter order = 20 poles
120 dB per octave/ 6 dB per octave = 20 poles
To filter a Worksheet record:
- Select the desired record(s).
 or
or 
 or
or 
Hanning Window
Applies a Hanning window to the selected worksheet record for use with the magnitude spectrum.
To impose a Hanning Window to a Worksheet record:
-
Select the desired record(s).
-
Select Hanning Window from the Calculator menu.
Cosine^2 Window
Applies a Cos2 window to the selected worksheet record (smooths the start and end of the waveform). Used with magnitude spectrum.
To impose a Cosine2 Window to a Worksheet record:
-
Select the desired record(s).
-
Select Cos^2 Window from the Calculator menu.
Mag Spectrum
Generates an FFT of the data using 1024-8192 points per FFT.
To impose a Mag Spectrum to a Worksheet record:
-
Select the desired record(s).
-
Select Mag Spectrum from the Calculator menu.
You will be prompted to enter the number of frequency points. This is the number of points to be included in the FFT used to compute the Mag Spectrum.