Data Acquisition
Once the configuration process has been completed, you are ready to present a stimulus and acquire data.
Subject Definition
You may wish to associate subject information with each group of signals added to the history plot. Such information may be defined in the Subject Information dialog box.
To access the Subject Information dialog box:
-
Select Subject Info from the Setup menu.
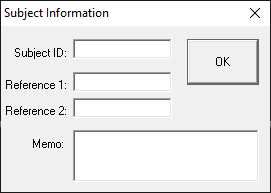
Subject ID
This subject identifier may be up to 15 characters in length. The Subject ID will be associated with all subsequently acquired data. The ID will be displayed in the history plot immediately above the history data. It will also be stored with the history data in the BioSigRZ record file (.arf file).
Reference 1
This reference text may be up to 15 characters in length. The text of Reference 1 will be associated with all subsequently acquired data. The character string will be displayed in the history plot immediately above the history data. It will also be stored with the history data in the BioSigRZ record file (.arf file).
Reference 2
This reference text may be up to 15 characters in length. The text of Reference 2 will be associated with all subsequently acquired data. The character string will be displayed in the history plot immediately above the history data. It will also be stored with the history data in the BioSigRZ record file (.arf file).
Memo
This character string may be up to 49 characters in length. This text will be associated with all subsequently acquired data. The text will not be displayed in the history plot, but will be stored with the history data in the BioSigRZ record file (.arf file). Memo text can be viewed from BioSigRZ Cursor Edit dialog box.
Auto-Cursors
You may specify up to 10 auto-cursors. Auto-cursors are cursors that are automatically placed at specific points in the signal as the signal is acquired. Auto-cursor position is determined through specification of an auto-cursor equation. You may specify an auto-cursor equation from the Specify Auto-Cursor Equation dialog box.
To access the Specify Auto-Cursor Equation dialog box:
-
Select Auto-Cursors from the Setup menu.
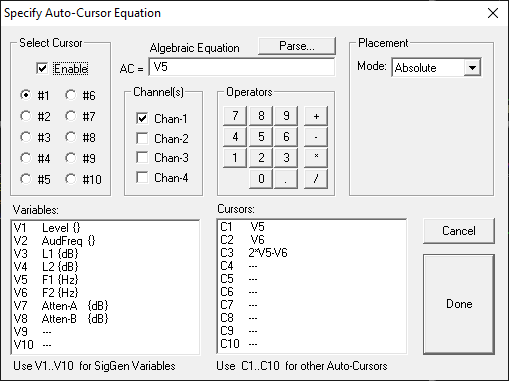
Select Cursor
From the Select Cursor group box, you may choose to specify an auto-cursor equation for any of the first 10 cursors.
To specify an auto-cursor:
- Click the desired cursor number in the Select Cursor box.
Specifying the Algebraic Equation
Specifying the algebraic equation may be accomplished in three steps:
-
Enabling auto-cursors
-
Specifying the equation
-
Parsing the equation
Enabling Auto-Cursoring
To enable auto-cursoring:
- Check the Enable checkbox
Specifying the Equation
You may now enter an auto-cursor equation in the Algebraic Equation field.
Auto-Cursor equations may include one or more SigGenRZ Variable. Instead of using the variable name, however, you must use a variable number. For example, if the variable you wish to use is level (the second variable in the BioSigRZ variable list) you would use V2.
V2 + 100
You may also use existing auto-cursors as variables in auto-cursor equations. Auto-cursor variables are specified by Cn, where n is the number of the auto- cursors. For example, if you wish to use auto-cursor #3 in an equation, use variable C3.
C3 - V2 + 100
Auto-cursors are placed in the time axis in time-domain waveforms and in the frequency axis in frequency-domain waveforms. Thus, the unit of measurement for time-domain auto-cursors is milliseconds, while the unit of measurement for frequency-domain auto-cursors is Hz.
Parsing the Equation
Once you have specified the equation, it must be parsed. During parsing, the equation is evaluated. Any errors noted during parsing will be reported.
Note
All auto-cursor equations must be parsed. Failure to parse the equation will result in a failure to use the equation during data acquisition.
To parse the equation:
- Click the Parse button
Accepting an Equation
Once an equation has been defined, it must be accepted.
To accept an equation:
- Click Done
To reject an equation:
- Click Cancel
Auto-Cursor Feature Finding
The auto-cursor feature will place up to 10 cursors on each acquired trace as a mathematical function of a variable or at a specific time or frequency. BioSigRZ supports automatic feature finding to minimize the amount of manual cursor manipulation that has to be performed after data acquisition.
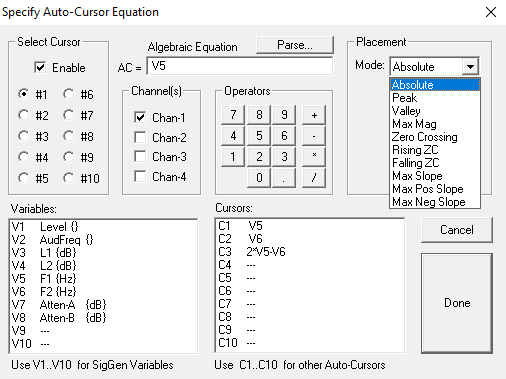
Placement
The settings under Placement allow you to specify placement of the cursor on the feature selected from the drop-down menu. The Placement will search over the specified range around the value calculated by the algebraic equation.
Absolute
The cursor will be placed at the position specified by the algebraic equation.
Peak
Cursor will be placed at the highest peak in the specified range.
Valley
Cursor will be placed at the lowest valley in the specified range.
Max Mag
Cursor will be placed at the maximum ± value in the specified range.
Zero Crossing
Cursor will be placed at the nearest zero crossing in the specified range.
Rising ZC
Cursor will be placed at the nearest rising (i.e. positive going) zero crossing in the specified range.
Falling ZC
Cursor will be placed at the nearest falling (i.e. negative going) zero crossing in the specified range.
Max Slope
Cursor will be placed on the maximum slope (either positive or negative) in the specified range.
Max Pos Slope
Cursor will be placed on the maximum positive slope in the specified range.
Max Neg Slope
Cursor will be placed on the maximum negative slope in the specified range.
Search From and To
This specifies the search range for the feature (e.g. peak, valley etc.). AC stands for AutoCursor.
For example, if the feature is set to peak and the result of the algebraic equation is 5 ms and the search range is From: AC -1.0 To: AC +1.0, the auto cursor will be placed on the highest peak between 4.0 ms and 6.0 ms.
Multiplicative
By default, the range specified in the search box will be added to the result of the algebraic equation. If the multiplicative box is checked, the range will be multiplied by the result of the algebraic equation.
Flag Edge Placements
If the placement of the cursor occurs at the beginning or end of the search range, clicking Flag Edge Placements, will cause the cursor to be flagged as such. For example, if the cursor placement was set for a peak at 5 ms (as in the following example), but the peak actually occurred before the search window, the cursor would be placed at the Start of the search window and would be flagged. This will let you know that you might want to manually move the cursor to the true peak, which was outside the search window.
Cursors in the Auto-Cursor Equation
When an auto-cursor's value is calculated based on the value of another auto- cursor, the calculation is performed on the absolute value of the cursors.
For example if two cursors are placed on the signal and the first one (C1) uses peak finding over a 200 Hz range while the second cursor (C2) is calculated as C1 + 100 Hz, the second cursor will be placed as a function of the absolute value of C1, not the value actually found in the search over the 200 Hz range.
Understanding BioSigRZ Operational Modes
Functions controlling the presentation of stimuli and the acquisition of data are controlled from the Operations Menu or from buttons displayed on the main window. The title and function of these menu options and buttons vary, depending on the current operational mode. For more information about modes, see The Operations Menu.
Operational modes consist of the following:
-
Idle: No stimulus presentation or data averaging.
-
Running: Stimulus is being presented.
-
Averaging: Response data is being acquired and averaged.
-
Paused: Data averaging has been temporarily suspended.
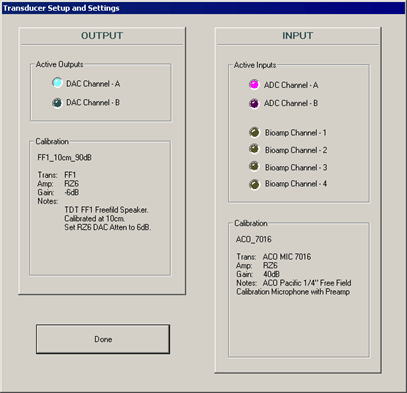
Idle Mode
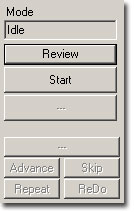
When BioSigRZ is in idle mode, no stimulus signals are presented and no data is acquired. It is during idle mode that you specify parameters, configure displays, and review hardware configurations.
To check the hardware configuration:
-
Click the Review button.
This prompts the Transducer Setup and Settings.
-
After you have reviewed the dialog and verified that the setup is correct, click Done.
Start is the only operation available in idle mode. Clicking the Start button begins stimulus presentation and causes BioSigRZ to enter running mode.
To present the stimulus:
- When in idle mode, click the Start button or select Start from the Operations menu.
Running Mode
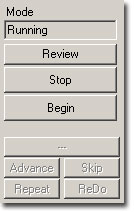
When in running mode, BioSigRZ continuously presents the stimulus signal based on the variable values associated with the current SGI as defined in the stimulus schedule. No data is averaged in running mode.
Stop and Begin are the only operations available in running mode. Clicking the Stop button halts stimulus presentation and returns BioSigRZ to idle mode. Clicking the Begin button begins data averaging, placing BioSigRZ in averaging mode.
To view the stimulus:
-
Access the Control Plot Toolbar of the Multi-purpose Plot
-
Click the Stimulus Signal
 button or
press 'S' on the keyboard
button or
press 'S' on the keyboard
You may alter the scale of the display or change the number of displayed channels through use of the Plot Control Toolbar.
To manually halt stimulus presentation:
- While in Running mode, click the Stop button or select Stop from the Operations menu.
To begin averaging data:
- While in Running mode, click the Begin button or select Begin from the Operations menu.
Averaging Mode
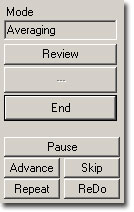
During averaging mode, BioSigRZ acquires data and calculates a running average. Data will be acquired until enough records have been gathered to compute the final averaged signal. At that time, the averaged signal will be appended to the end of the History Plot, the SGI will be incremented, a new stimulus signal will be generated according to the current stimulus parameters, and a new average will be computed. This process continues until the termination of the stimulus schedule is reached or until you manually end data averaging.
During averaging mode, the operations End and Pause are available. In addition, you may access four manual control functions: Advance, Skip, Repeat, and ReDo. These functions are defined in the Real-Time Control section.
During data acquisition, you may use the Multi-Purpose Plot to view:
-
The stimulus signal
-
The raw A/D input
-
The frequency domain
-
The EEG signal
-
The running average
-
Nothing
To choose a signal type for display in the Multi-Purpose Plot:
-
Access the Plot Control Toolbar of the Multi-purpose Plot.
-
Click the appropriate button.
You may alter the scale of the display or change the number of displayed channels through use of the Plot Control Toolbar. See Multi-Purpose Plot., for more information.
To manually end data averaging:
- While in Averaging mode, click the End button or select End from the Operations menu.
BioSigRZ will return to Running mode. The current stimulus signal will continue to be presented until manually halted as described previously.
To pause data averaging:
- While in Averaging mode, click the Pause button or select Pause from the Operations menu.
Data averaging will pause. The stimulus signal will continue to be presented.
Paused Mode
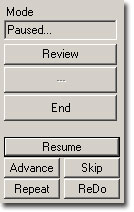
In paused mode, data averaging is temporarily halted. Stimulus presentation continues.
From paused mode, the operations End and Resume are available. The four manual control functions, Advance, Repeat, Skip, and ReDo are also available. These functions are defined in the Real-Time Control section of this chapter on page 80.
To resume data averaging:
- Click the Resume button or select Resume from the Operations menu.
To manually end data averaging:
- While in Averaging mode, click the End button or select End from the Operations menu.
BioSigRZ will return to Running mode. The current stimulus signal will continue to be presented until manually halted as described previously.
Control of Data Acquisition
You may control data acquisition automatically or in real-time.
Automatic Control
Automatic control begins with the specification of the stimulus schedule. Once the stimulus schedule has been specified, you may make further modifications to automatic stimulus presentation through use of some of the SGI Control features shown above.
Modifying the Stimulus Schedule
The manner in which stimulus parameter values vary as a function of the SGI is initially defined during signal design in SigGenRZ. You may make further modifications to the stimulus schedule from within BioSigRZ. See Specifying the Stimulus Schedule for more information.
Note
The Modify Schedule option in the Operations menu provides access to the SigGenRZ Variable Control dialog box, from which you may alter the stimulus schedule.
Automatic Repetition of the SGI
You may wish to repeat an SGI automatically. BioSigRZ allows you to automatically present an SGI once, twice, or three times.
To present an SGI once only:
- Make sure that the Each Twice and Each Thrice checkboxes are not checked.
To present an SGI twice:
- Check the Each Twice box.
To present an SGI three times:
- Check the Each Thrice box.
Real-Time Control
You may wish to control data averaging in real time. BioSigRZ provides several functions that allow you to override the current stimulus schedule. These functions include:
-
Advance
-
Skip
-
Repeat
-
ReDo
-
Continuous Avg.
-
Manual SGI Control
-
Dynamic Variable Control
Note
In some cases, real-time control of data averaging will result in averaged signals based on some number < N, where N is the number of signals per average that you specified during setup. The actual number of signals used to compute the average is associated with the record and stored in the BioSigRZ record file, (.arf file). It may be viewed from the BioSigRZ Cursor Edit Screen. See Viewing Records in Detail for more information.
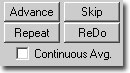
Advance
The Advance function causes the stimulus to advance to the next SGI specified in the stimulus schedule. This menu option is enabled in Averaging and Paused modes, only. When advance is chosen, the following process occurs:
-
Stimulus presentation at the current SGI is halted.
-
The running average for the current SGI is saved to the BioSig record file (.arf file).
-
The averaged signal is appended to the history plot.
-
Stimulus presentation is advanced to the next SGI as defined in the stimulus schedule.
-
A new stimulus signal is generated based on the stimulus parameters for the new SGI.
-
Data averaging begins at the new SGI.
To advance data averaging to the next SGI:
While in Averaging or Paused mode,
- Click the Advance button or select Advance from the Operations menu.
Skip
The Skip function causes the stimulus to skip the current SGI. This menu option is enabled in Averaging and Paused modes. The process is as follows:
-
The average for the current SGI is discarded.
-
Stimulus presentation is advanced to the next SGI specified in the stimulus schedule.
-
A new stimulus signal is generated based on the stimulus parameters for the new SGI.
-
Data averaging begins at the new SGI.
To skip the current SGI:
While in Averaging or Paused mode,
- Click the Skip button or select Skip from the Operations menu.
Repeat
The Repeat function repeats the current SGI. This menu option is enabled in Averaging and Paused modes. The process is as follows:
-
The running average for the current SGI is saved to the BioSig record file (.arf file).
-
The averaged signal is appended to the history plot.
-
The stimulus is re-presented at the current SGI.
-
This second average is also saved to the BioSig record file (.arf file) and appended to the history plot.
To repeat the current SGI:
While in Averaging or Paused mode,
- Click the Repeat button or select Repeat from the Operations menu.
ReDo
The ReDo function restarts the current SGI. This menu option is enabled in Averaging and Paused modes. The process is as follows:
-
The average for the current SGI is discarded.
-
The stimulus is re-presented at the current SGI.
-
This second average is saved to the BioSig record file (.arf file) and appended to the history plot.
To re-do the current SGI:
While in Averaging or Paused mode,
- Click the ReDo button or select ReDo from the menu.
Continuous
Choosing Continuous causes BioSigRZ to continuously average data. When Continuous is chosen, BioSigRZ will continue to average response data indefinitely, regardless of n, the number of signals per average that you specified during setup.
To enable continuous data averaging:
- Check the Continuous Avg. checkbox or select Continuous from the Operations menu.
To disable continuous data averaging:
- Uncheck the Continuous Avg. checkbox or select Continuous from the Operations menu.
This will disable continuous data averaging. Data averaging will continue based on the acquisition parameters that you specified during setup.
To halt continuous data averaging:
- Click the End button or select End from the Operations menu.
This will end all data averaging.
Manual SGI Control
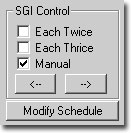
You may manually advance stimulus presentation through use of Manual SGI Control.
To enable manual control:
- Check the Manual checkbox.
To advance to the next SGI:
- Click the
 button.
To return to a previous SGI:
- Click the
 button.
Dynamic Variable Control
You may manually control stimulus presentation through the use of dynamic variables. A variable may be defined as dynamic during design in SigGenRZ or during modification in BioSigRZ. The value of a dynamic variable may be changed at any time during stimulus presentation.
To display all dynamic variables:
- Select Dyn Controls from the View menu.
A dynamic variable settings prompt will be displayed for each dynamic variable.
To change the current value of a dynamic variable:
-
Click the Current button
-
Enter the desired value
-
Click OK
You may wish to dynamically specify a step value, or Delta value. A Delta value defines how the variable will be modified with each SGI. The Next button displays the projected value of the variable for the next SGI given the current Delta value.
To specify a Delta value:
-
Click the Delta button
-
Enter the desired Delta value
-
Click OK
You may wish to override the value of the variable for the next SGI.
To override the next value:
-
Click the Next button
-
Enter the desired value
-
Click OK
You may wish to decrement the variable by the specified Delta value. You may reverse the sign of the Delta value by clicking the ± Delta button.
Acquisition Filter Controls
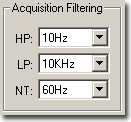
BioSigRZ provides three dynamic filter controls for adjusting acquisition corner frequencies and filter characteristics. Highpass, lowpass, and notch filters provide a comprehensive selection of filter configurations. The Acquisition Filtering control applies the selected filter settings during Running and Averaging modes.
To configure acquisition filters:
- Select the filter characteristics using the drop-down menu for the desired filter type(s).
The filter effects can be observed in the EEG and RAW A/D plots during Running Mode for fine tuning prior to averaging and recording. See Multi-Purpose Plot., for more information on these plot display.