Workspace Basics
Getting to Know the BioSigRZ Main Window
BioSigRZ's main window is designed to provide customizable visual displays of
the stimulus signal, raw response signals, running averages, history data, and
reports.
The Start-up Window
Upon starting BioSigRZ, you will see the main BioSigRZ window. If you are
running BioSigRZ for the first time, the main window will appear in its default
layout, as seen below.
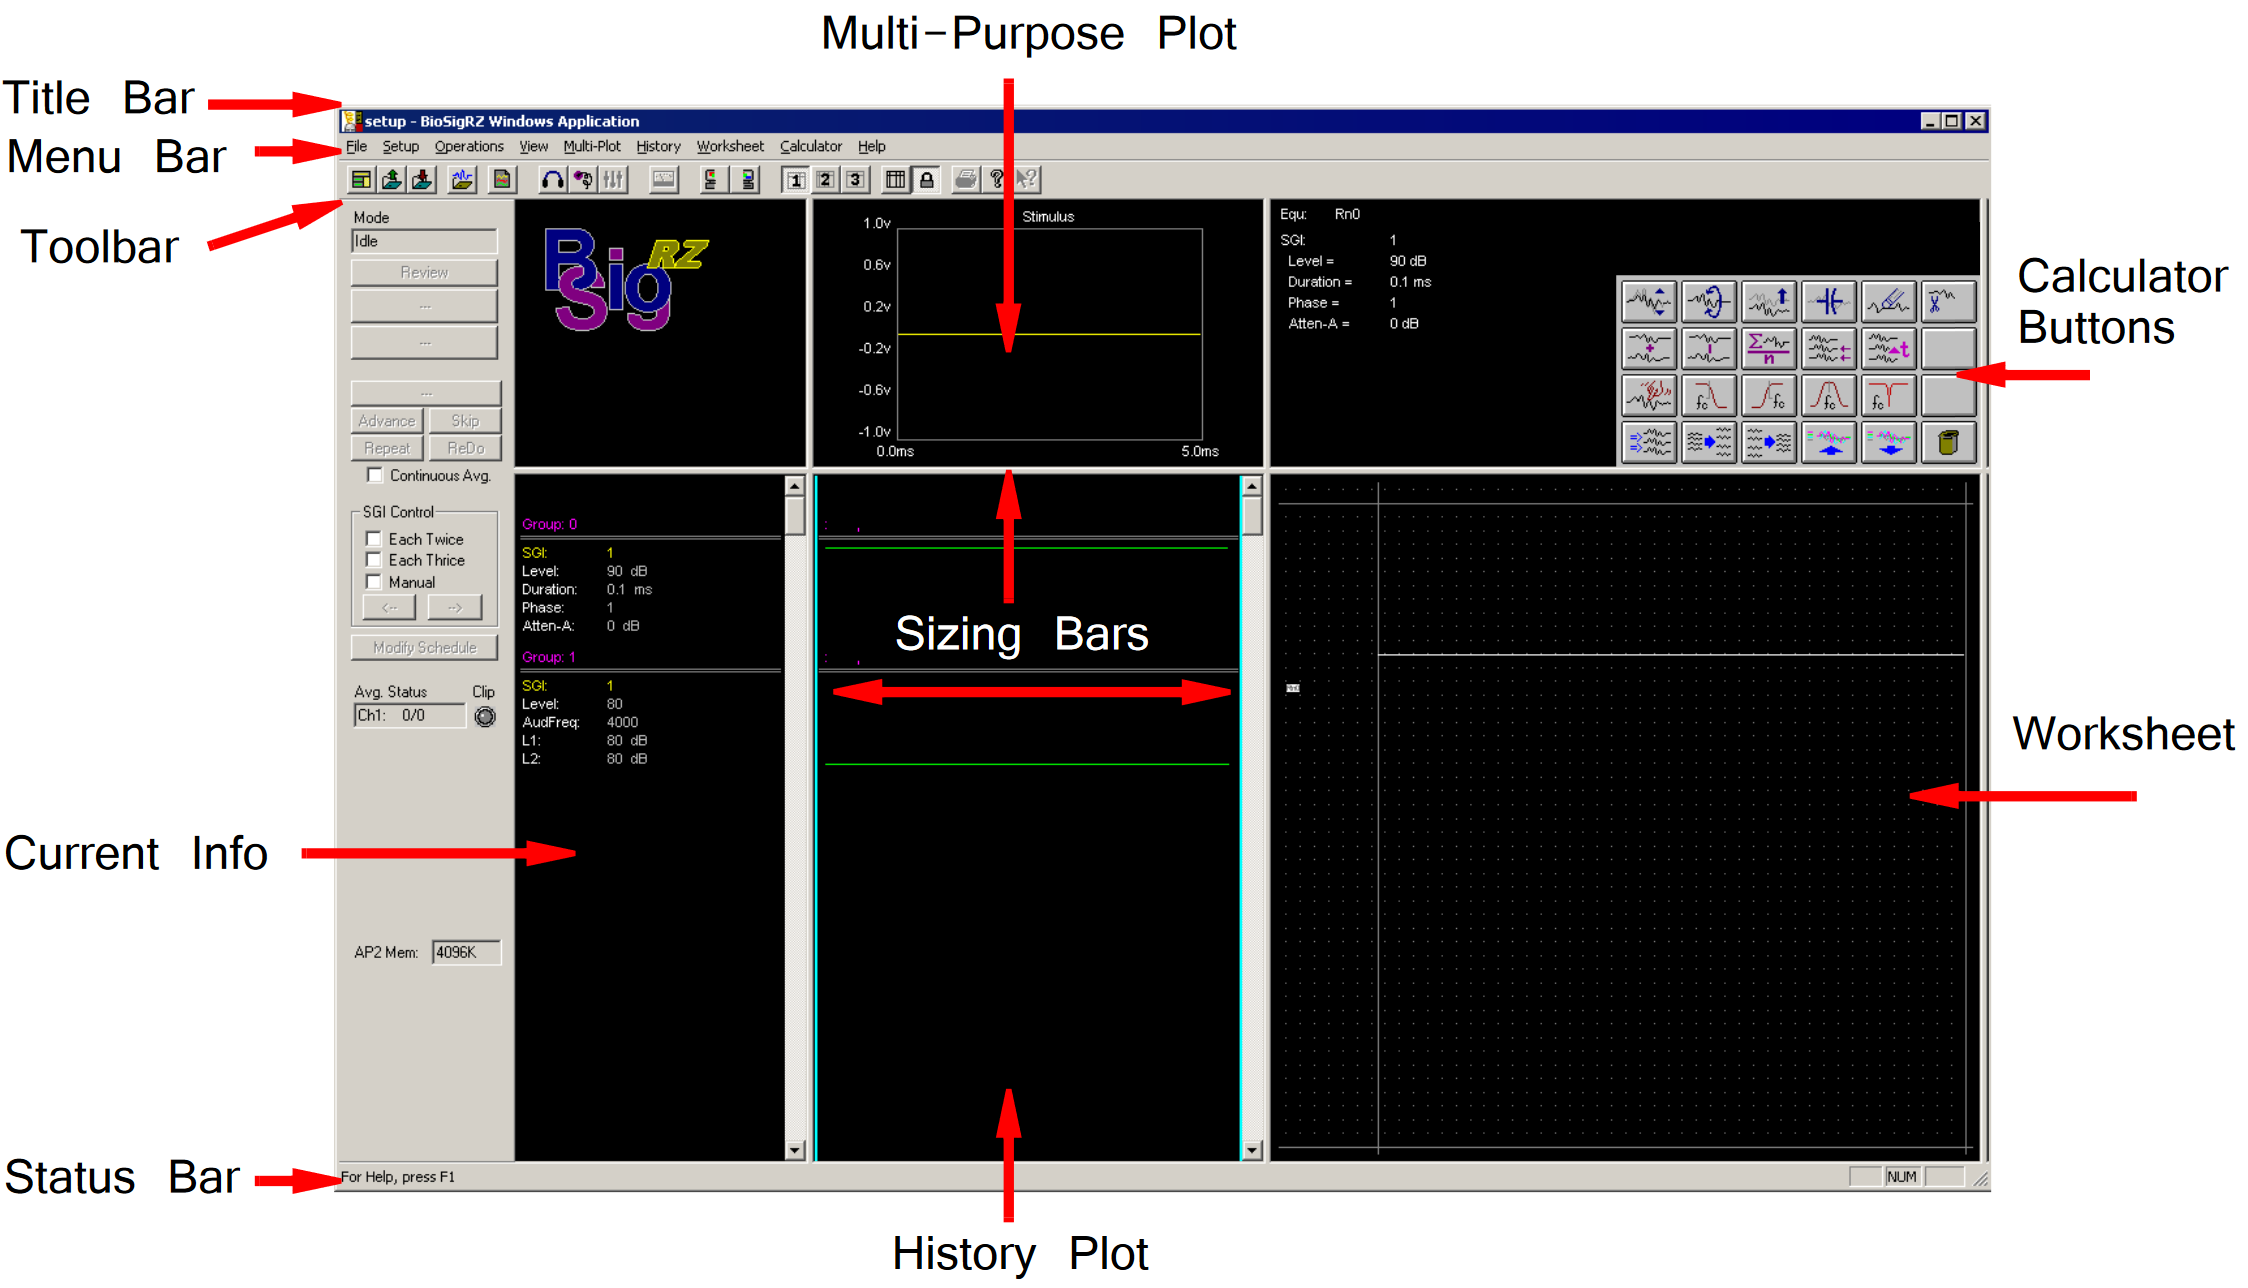
The window contains the following sections:
| Section |
Description |
| Title Bar |
Displays "BioSigRZ Windows Application" and the name of the current BioSigRZ file |
| Menu Bar |
Contains a list of menus used for building, manipulating, and saving your BioSigRZ file |
| Toolbar |
Provides easy-to-use icons for the most common BioSigRZ Menu commands |
| Multi-Purpose Plot |
May be used to display a plot of the stimulus signal, the raw A/D signal, the FFT of the signal, the EEG signal, or the running average |
| History Plot Area |
Is used to display historical, averaged signal data |
| Current Info |
Displays the current SigGenRZ Index (SGI) plus variable names and their current values |
| History Info |
Displays Group information. Responses obtained during the same data acquisition session are collectively referred to as a Group. Groups are automatically sequentially numbered. For each History Plot record, the names and values of variables are displayed. |
| Calculator |
Allows you to perform mathematical operations on one or more Worksheet records |
| Worksheet |
May be used to store records for use in calculations and to build reports |
| Sizing Bars |
Allow the user to resize each area of the screen |
| Status Bar |
Provides information about the selected command |
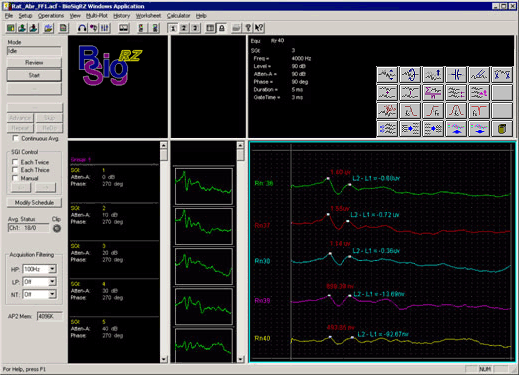
The Customized Window
BioSigRZ provides numerous displays. Depending on your needs, you may wish to
enlarge some displays and reduce others.
To enlarge/reduce a display area:
- Drag the appropriate Sizing Bar.
Below, the BioSigRZ main window is configured to provide more room in the
Worksheet area. The Calculator area has been expanded so that most calculator
and worksheet buttons are visible.
BioSigRZ provides the user with a full set of menu commands. From these menu
commands, you can create, open, and save files; customize screen displays;
present stimulus signals; acquire response data; and analyze data.
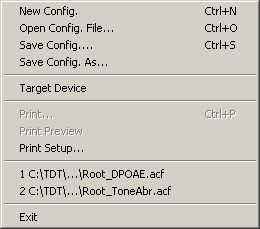
The File Menu provides a standard Windows method for creating, saving, opening,
closing, and printing files.
| Menu Option |
Description |
| New Config |
Resets all screen objects to their default states and clears all plots |
| Open Config. File |
Opens and displays an existing BioSigRZ configuration file (.acf file) |
| Save Config / .As |
These menu options save BioSigRZ configuration data in a BioSigRZ configuration file.
Files saved with this format use the default extension .acf. |
| Target Device |
Prompts the device selection window |
| Print |
Prints the current Worksheet Area |
| Print Preview |
Allows you to view the Worksheet Area as it will be printed |
| Print Setup |
Allows you to select a printer, define the paper size, and choose a page orientation |
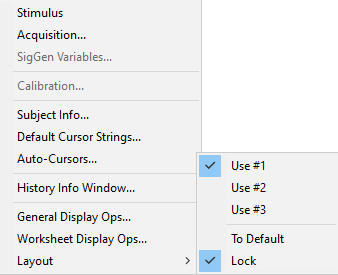
From the Setup Menu, you can define stimulus and acquisition parameters, adjust
stimulus parameters, calibrate the system, enter subject information, and
customize the BioSigRZ interface.
| Menu Option |
Description |
| Stimulus |
Opens the Stimulus Setup dialog box. From this box you can specify up to two SigGenRZ stimulus signals and define presentation parameters. |
| Acquisition |
Opens the Acquisition Setup dialog box, from which you can set timing parameters, define the default record file (.arf file), and configure up to four acquisition channels. |
| SigGen Variables |
Opens the SigGenRZ Variable Control dialog box. From this dialog box, you can customize stimulus presentation. |
| Calibration |
Opens the calibration review dialog. See Reviewing Calibration for more information |
| Subject Info |
Opens the Subject Information dialog box. This dialog box contains fields where you can enter identifying information for the subject. |
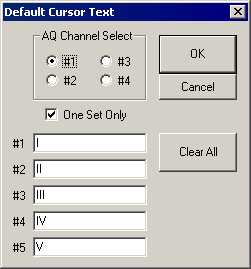
| Default Cursor Strings |
Opens the Specify Default Cursor Text dialog box, from which you can customize cursor labels |
| Auto-Cursors |
Opens the Specify Auto-Cursor Equations window, from which you can specify the location of up to 10 cursors. These cursors will be automatically placed during data acquisition. |
| History Info Window |
Opens the Info-Bar Setup dialog box, from which you can customize the History Info display area |
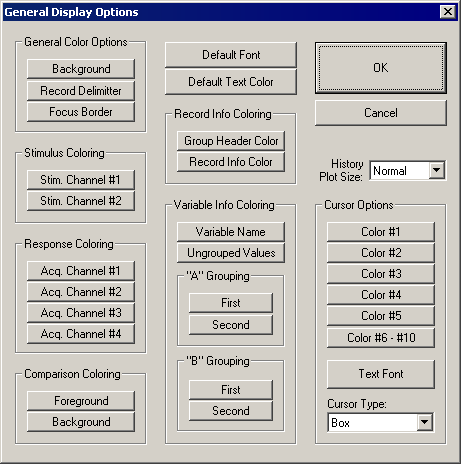
| General Display Ops |
Opens the General Display Options dialog box. From this dialog box, you can customize background colors, plot colors, text colors, and other display characteristics of the main window, Multi-Purpose Plot, and History Plot. |
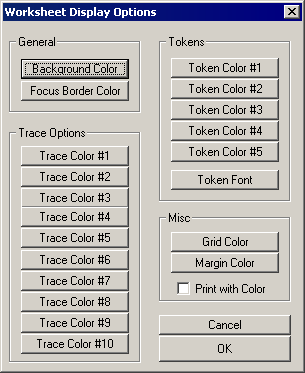
| Worksheet Display Ops |
Opens the Worksheet Display Options dialog box. From this dialog box, you can customize various display features of the Worksheet. |
| Layout |
Displays a submenu, you can use to select a screen layout |
| Use #1, Use # 2, Use #3 |
Switch between three custom defined screen layouts |
| To Default |
Returns the screen layout to its initial, default layout. |
| Lock |
Locks/unlocks the current screen configuration. |
| Idle |
Running |
 |
 |
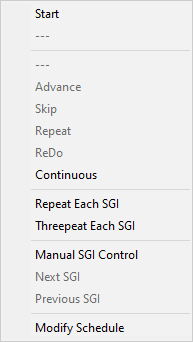
The Operations Menu provides a list of commands that control the presentation of
the stimulus signal and the acquisition of response signals. Menu options vary,
depending on the current operational mode. Operational modes consist of the
following:
- Idle - No stimulus presentation or data acquisition
- Running - Stimulus is being presented
- Averaging - Response data is being acquired and averaged
- Paused - Data averaging has been temporarily suspended
| Menu Option |
Description |
| Start |
Begins the presentation of the stimulus signal. This menu option appears in Idle mode only. |
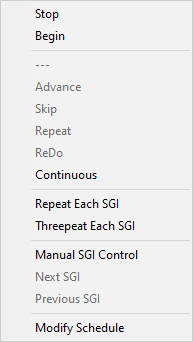
| Stop |
Discontinues the presentation of the stimulus signal. This menu option appears in Running mode only. |
| Begin |
Begins the process of data acquisition and signal averaging. This menu option appears in Running mode only. |
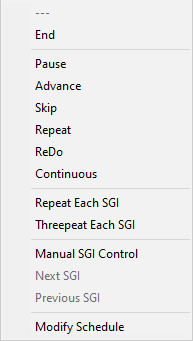
| End |
Discontinues data acquisition and signal averaging. This menu option appears in Averaging mode only. |
| Pause |
Temporarily halts data averaging. This menu option appears only in Averaging mode. |
| Averaging |
Paused |
 |
 |
| Menu Option |
Description |
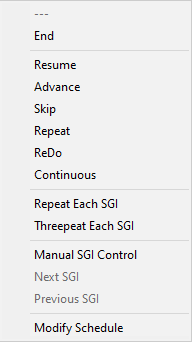
| Resume |
Resumes data averaging. This menu option appears only in Paused mode. |
| Advance |
Causes the stimulus to advance to the next SGI. This menu option is enabled in Averaging and Paused modes. |
| Skip |
Causes the stimulus to skip the current SGI. This menu option is enabled in Averaging and Paused modes. |
| Repeat |
Saves the current running average, re-presents the same stimulus, and saves the resulting averaged signal. This menu option is enabled in Averaging and Pausedmodes. |
| ReDo |
Discards the current running average, re-presents the same stimulus, and saves the resulting averaged signal. This menu option is enabled in Averaging and Paused modes. |
| Continuous |
Enables continuous data acquisition. BioSigRZ will continue to acquire and average response data for the same stimulus until Continuous is disabled or the Advance, Stop, Repeat, ReDo, or End buttons are clicked. |
| Repeat Each SGI |
Acquires two averaged signals for each SGI specified in the stimulus schedule |
| Threepeat Each SGI |
Acquires three averaged signals for each SGI specified in the stimulus schedule |
| Manual SGI Control |
Enables the Next SGI and Previous SGI buttons and menu options. These buttons can be used to manually control the SGI. |
| Next SGI |
Advances the stimulus to the next SGI |
| Previous SGI |
Moves the stimulus back to the previous SGI |
| Modify Schedule |
Opens the SigGenRZ Variable Control dialog box. From this dialog box, you can customize stimulus presentation. |
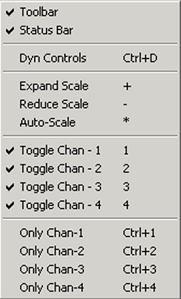
From the View Menu, you can turn various visual displays on or off.
| Menu Option |
Description |
| Tool Bar |
Shows/hides the Tool Bar |
| Status Bar |
Shows/hides the Status Bar |
| Dyn Controls |
Displays all active Dynamic Control windows. Dynamic controls can be enabled for the desired variable in the Signal Variable dialog. |
| Expand Scale |
Expands the scale of the focus plot |
| Reduce Scale |
Reduces the scale of the focus plot |
| Auto-Scale |
Automatically scales the focus plot |
| Toggle Chan - N |
Shows/hides Channel N on the focus plot |
| Only Chan-N |
Shows only Channel N on the focus plot |
Note
Whenever you click in a plot area, that plot receives the focus. Focus is
indicated by a thin frame of highlight surrounding the plot area. Plot
commands affect the focus plot only.
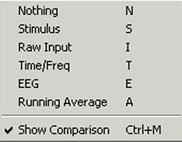
From the Multi-Plot menu, you can specify which signal you would like to display
in the Multi-Purpose Plot.
| Menu Option |
Description |
| Nothing |
Causes no plot to be displayed in the Multi-Purpose Plot |
| Stimulus |
Causes the current stimulus to be displayed in the Multi-Purpose Plot |
| Raw Input |
Causes one or more channels of raw (unprocessed) input signal to be displayed in the Multi-Purpose Plot |
| Time/Freq |
Performs an FFT on the incoming time-domain signal, producing frequency-domain response data. |
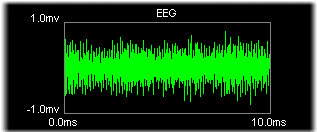
| EEG |
Causes one or more channels of EEG signal to be displayed in the Multi-Purpose Plot. EEG signals are created by applying the specified acquisition setup parameters (such as gain) to raw input signals. See Defining Data Acquisition Parameters for more information. |
| Running Average |
Causes the running average to be displayed |
| Show Comparison |
Causes the currently defined comparison plot to be displayed superimposed with the running average. Running Average must be selected in order to view the comparison plot. |
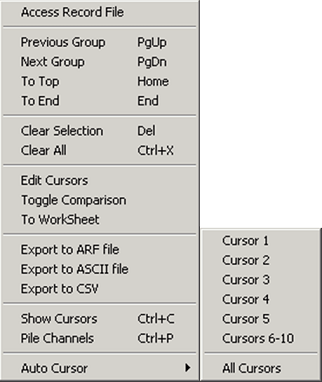
From the History Menu, you can load history records and perform various
operations on records displayed in the History Plot.
| Menu Option |
Description |
| Access Record File |
Loads previously saved BioSigRZ records from files known as BioSigRZ record files. These files use the default extension, .arf. BioSigRZ records are displayed in the History Plot Area. |
| Previous Group |
Scrolls the History Plot to the top of the previous group |
| Next Group |
Scrolls the History Plot to the top of the next group |
| To Top |
Scrolls the History Plot to the top |
| To End |
Scrolls the History Plot to the bottom |
| Clear Selection |
Clears all selected records from the History Plot |
| Clear All |
Clears all records from the History Plot |
| Edit Cursors |
Accesses the BioSigRZ Cursor Edit dialog box. From this dialog box, you may place cursors and obtain signal information. |
| Toggle Comparison |
Marks the most recently selected history record for use as a comparison when viewing records details from the history area. |
| To WorkSheet |
Allows you to place the most recently selected history record in the Worksheet |
| Export to ARF File |
Saves the currently selected history records in a user-defined BioSigRZ record file (.arf file) |
| Export to ASCII File |
Saves the currently selected history records in a user-defined ASCII file (.txt file) |
| Export to CSV |
Saves the currently selected history records in a user-defined CSV file |
| Show Cursors |
Displays any cursors placed in History Plot records |
| Pile Channels |
Overlays multiple channel history data |
| Auto Cursor |
Applies the selected auto cursor to the selected history record. See Auto-Cursors for more information. |
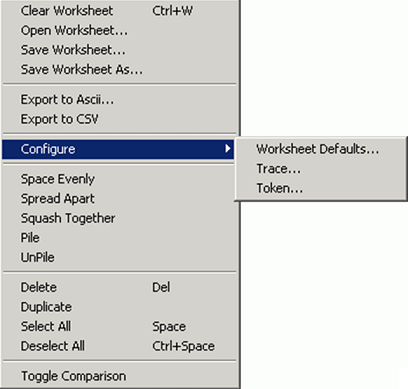
| Menu Option |
Description |
| Clear Worksheet |
Clears the entire Worksheet |
| Open Worksheet |
Opens a Worksheet file (.awf file) |
| Save Worksheet |
Saves an existing Worksheet file |
| Save Worksheet As |
Save a new Worksheet file |
| Export to Ascii |
Saves the currently selected records in a user-defined ASCII file (.txt file) |
| Export to CSV |
Saves the currently selected records in a user-defined CSV file |
| Configure Worksheet Defaults |
Allows you to set Worksheet preferences such as colors, plot size, and grid resolution. |
| Configure Tract |
Displays a message describing how to edit a trace |
| Configure Token |
Displays a message describing how to edit a token |
| Space Evenly |
Spaces selected plots evenly throughout the Worksheet |
| Spread Apart |
Spreads selected plots apart. Spread Apart may be used repeatedly. Each use continues to further spread apart all selected plots. |
| Squash Together |
Squashes selected plots together. Squash Together may be used repeatedly. Each use continues to further squash together all selected plots. |
| Pile |
Piles selected plots on top of one another |
| UnPile |
Unpiles selected plots |
| Delete |
Deletes the currently selected Worksheet records |
| Select All |
Selects all Worksheet records |
| Deselect All |
Deselects all Worksheet records |
| Toggle Comparison |
Marks the most recently selected worksheet record for use as a comparison in the worksheet. |
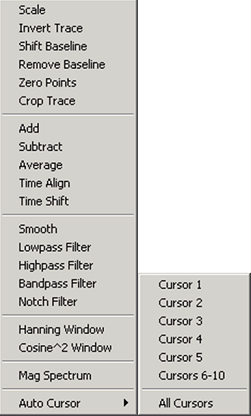
The Calculator Menu provides mathematical operations that may be applied to one
or more records displayed in the Worksheet.
| Menu Option |
Description |
| Scale |
Multiplies each point in the selected Worksheet record(s) by a specified constant. |
| Invert Trace |
Multiplies each point in the selected Worksheet record(s) by -1 |
| Shift Baseline |
Creates a DC offset by adding a specified constant to each point in the selected Worksheet record(s). |
| Remove Baseline |
Removes the DC offset |
| Zero Points |
Sets all points within a specified time range to zero |
| Crop Trace |
Crops the selected trace from the specified starting point (ms) to the specified ending point (ms). |
| Add |
Adds two or more Worksheet records |
| Subtract |
Subtracts one Worksheet record from another |
| Average |
Computes the average of two or more Worksheet records |
| Time Align |
Aligns all selected records with the first record in the selected group |
| Time Shift |
Shifts the selected Worksheet record(s) along the time axis |
| Smooth |
Applies a smoothing algorithm to the selected Worksheet record(s) |
| Lowpass Filter |
Applies a low-pass filter to the selected Worksheet record(s) |
| Highpass Filter |
Applies a high-pass filter to the selected Worksheet record(s) |
| Bandpass Filter |
Applies a band-pass filter to the selected Worksheet record(s) |
| Notch Filter |
Applies a notch filter to the selected Worksheet record(s). |
| Hanning Window |
Generates a Hanning window for use with the magnitude spectrum |
| Cosine^2 Window |
Generates a Cosine2 window for use with the magnitude spectrum |
| Mag Spectrum |
Does a FFT and generates a magnitude spectrum of the data |
| Auto Cursor |
Applies the selected auto cursor to the selected worksheet record |
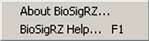
From the Help Menu, you can access the About BioSigRZ dialog box. Clicking the
BioSigRZ Help option or pressing the F1 button at any time prompts the BioSigRZ
Manual.
On the BioSigRZ Toolbar, you can find quick point-and-click access to the most
common commands.
| Click |
|
To |
 |
New |
Clear all plots and reset BioSigRZ to its default configuration. |
 |
Open |
Open an existing BioSig file. |
 |
Save |
Save a BioSig file. |
 |
BioSig Records |
Load records stored in an .arf file. |
 |
Worksheet Records |
Load an .awf file. |
 |
Setup Stimulus |
Define stimulus parameters. |
 |
Setup Acquisition |
Define acquisition parameters. |
 |
Modify SigGen Variables |
Modify the Stimulus Schedule and variables. |
 |
Calibrate |
Open Calibration menu. |
| Click |
|
To |
 |
General Display |
Configure general display fonts and colors. |
 |
Worksheet Display |
Configure Worksheet display fonts and colors. |
 |
Setup #1 |
Switch the screen layout to #1. |
 |
Setup #2 |
Switch the screen layout to #2. |
 |
Setup #3 |
Switch the screen layout to #3. |
 |
Default Layout |
Auto adjusts the current layout to the default layout. |
 |
Lock |
Lock the screen layout. |
 |
Print |
Print the current history plot. |
 |
About BioSigRZ |
Access about BioSigRZ dialog. |
 |
Context-Sensitive Help |
Context-sensitive help is not currently supported. ### The Plot Control Toolbar |
The multi-purpose and history plots are controlled through the use of the Plot
Control Toolbar. This toolbar is normally invisible.
The Plot Control Toolbar may be used to control the plot area that currently has
the focus.
Note
Whenever you click in a plot area, that plot receives the focus . Focus is
indicated by a thin frame of highlight surrounding the plot area. Plot commands
affect the focus plot, only.
To display the Plot Control Toolbar:
To click a Plot Control Toolbar button:
-
With the right mouse button depressed, place the mouse pointer above the desired toolbar button.
-
Release the right mouse button.
The button will be clicked. With the release of the right mouse button, the Plot Control toolbar
will disappear.
 |
|
Scaling | Customization | Channels |
The Plot Control Toolbar is customized for each BioSigRZ plot. However, there
are certain common features found in all Plot Control Toolbars. Each toolbar
consists of the following sections.
-
Scaling Section
-
Customization Section
-
Channels Section
Scaling Section

Located on the far left of the Plot Control Toolbar, the scaling section
consists of three buttons that may be used to alter plot scaling. These scaling
commands may also be accessed from the View Menu.
| Click |
Numpad
Shortcut |
|
To |
 |
* |
Auto-Scale |
When Auto-Scale is chosen, BioSigRZ will automatically scale the plot that currently has the focus. |
 |
+ |
Expand Scale |
Choosing Expand Scale causes the scale of the focus plot to expand. You may continue to expand the scale by repeatedly choosing Expand Scale. |
 |
- |
Reduce Scale |
Choosing Reduce Scale causes the scale of the focus plot to be reduced. You may continue to reduce the scale by repeatedly choosing Reduce Scale. |
 |
|
Expand Scale |
 |
|
Reduce Scale |
Customization
Each plot area has its own specialized plot control functions. Buttons
controlling these functions are found in the center of the Plot Control Toolbar.
See The Multi-Purpose Plot below and See The History Plot., for more
information.
Channels

You may wish to display some or all channels in the current plot. Located on the
far right of the Plot Control Toolbar, the channels section consists of four
buttons that may be used to show/hide channels. These channel commands may also
be accessed from the View Menu.
Channel buttons are independent. That is, more than one channel button may be
"on" at one time. Channel buttons act like toggle switches. Clicking a button
that is "on" turns it "off." Clicking a button that is "off" turns it "on." As
with Scaling buttons, "on" buttons appear depressed.
Channels are indicated in Roman numerals, I, II, III, and IV.
To show/hide a channel:
-
Display the Control Plot Toolbar.
-
Turn the channel "on" or "off" by clicking its button.
Note
If none of the channel buttons are turned "on," no plot will be displayed. The
plot area will appear blank.
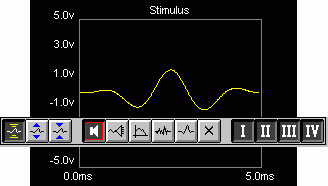
Multi-Purpose Plot
The Multi-Purpose Plot may be used to display a variety of signals during
stimulus presentation and data averaging. The plot is controlled through the use
of the Plot Control Toolbar.
As with all other plots, you can control the scaling and channel display through
use of the Plot Control Toolbar. Functions specific to the Multi-Purpose Plot
are found in the center of the toolbar. These functions may also be accessed
from the Multi-Plot menu.
Types of Displays

The buttons located in the center of the Plot Control Toolbar control the Multi-
purpose signal display. The Multi-purpose Plot may be used to display the
following signals:
| Click |
for Display Type |
 |
Stimulus |
 |
Raw A/D |
 |
Frequency Domain |
 |
EEG |
 |
Running Average |
 |
None |
Plot display buttons are mutually exclusive. That is, clicking one display button
turns that function "on" and turns all other display functions "off." "On" buttons
appear depressed.
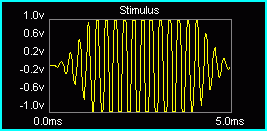
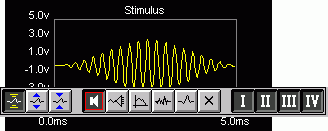
Stimulus
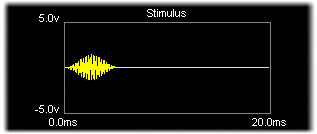
Choosing Stimulus causes the current stimulus signal to be displayed. BioSigRZ
allows up to two channels of stimulus output.
To display the Stimulus signal:
-
Display the Control Plot Toolbar.
-
Click the Stimulus Signal button or
press 'S' on the keyboard.
Raw A/D
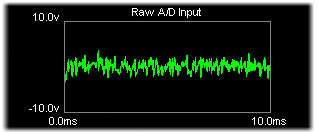
Choosing Raw A/D Input causes unprocessed A/D input to be displayed. Raw input
is not affected by currently defined acquisition setup parameters such as gain
but will display the effects of acquisition filter settings.
To display the raw A/D signal:
-
Display the Control Plot Toolbar.
-
Click the Raw A/D Input button or press 'I'
on the keyboard.
Frequency Domain
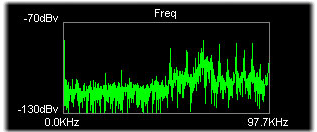
Choosing Frequency Domain causes the Raw A/D input to be displayed in the
frequency domain.
To display the frequency-domain A/D signal:
-
Display the Control Plot Toolbar.
-
Click the Frequency Domain button
or press 'T' on the keyboard.
EEG
Choosing EEG causes processed input to be displayed. EEG data is affected by
currently defined acquisition setup parameters such as gain and any acquisition
filter settings that are applied.
To display the EEG signal:
-
Display the Control Plot Toolbar.
-
Click the EEG button or press 'E on the
keyboard.
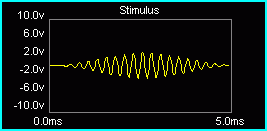
Running Average
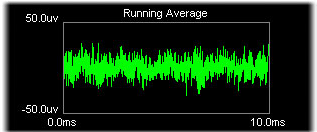
Choosing Running Average causes the current averaged EEG signal to be displayed.
To display the running average:
-
Display the Control Plot Toolbar.
-
Click the Running Average button or
press 'A' on the keyboard.
None
Choosing None causes no signal to be displayed and the plot area will appear
blank.
To display no signal:
-
Display the Control Plot Toolbar.
-
Click the Display None or press
'N' on the keyboard.
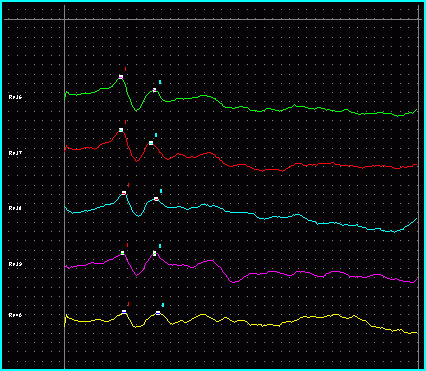
The History Plot

The History Plot is used to display historical averaged signal data. The plot is
controlled through the use of the Plot Control Toolbar.
You can control the scaling and channel display through use of the Plot Control
Toolbar. Functions specific to the History Plot are found in the center of the
toolbar. These functions may also be accessed from the History menu.

History Plot data is organized into groups. Each time you tell BioSigRZ to begin
collecting data, it begins a new group. Data records are appended to the end of
the group until you halt data collection. When data collection is resumed, a new
group is appended to the end of the History Plot.
You may quickly scroll to the top or bottom of a group using the scrolling
buttons.
To scroll to the top of the previous group:
-
Display the Control Plot Toolbar.
-
Click the Scroll Up  button or press
'Page Up' on the keyboard.
button or press
'Page Up' on the keyboard.
To scroll to the top of the next group:
-
Display the Control Plot Toolbar.
-
Click the Scroll Down  button or press
'Page Down' on the keyboard.
button or press
'Page Down' on the keyboard.
Editing Functions

You may edit the History Plot using the editing buttons. You may perform editing
functions on all records or just those that are selected. Selected records
appear surrounded by a frame of highlight.
Selecting Records
You may select one record, multiple contiguous records, or multiple non-
contiguous records for editing using standard, Shift+click and Ctrl+click
Windows methods.
Editing
To clear selected History Plot records:
-
Display the Control Plot Toolbar.
-
Click the Clear Selected Record  button.
To clear all History Plot records:
-
Display the Control Plot Toolbar.
-
Click the Clear History  button or press
Ctrl + 'X' on the keyboard.
button or press
Ctrl + 'X' on the keyboard.
Note
BioSigRZ maintains a file of historical records knows as the BioSigRZ record
file (.arf file). As history records are acquired, they are appended to this
file. Clearing a record from the History Plot does not remove the record from
the BioSigRZ record file. Records stored in the BioSigRZ record file can be
retrieved and viewed in the History Plot by choosing Access Record File from the
History menu.
BioSigRZ provides mathematical functions that may be applied to one or more
Worksheet record(s). These functions may be accessed from the Calculator menu or
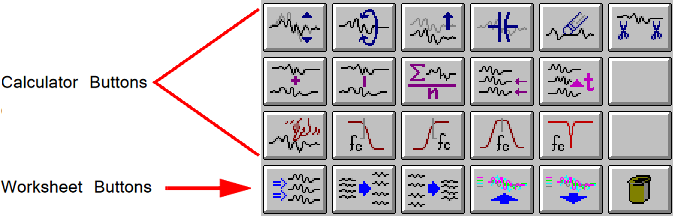
from buttons displayed in the area of the main window known as the Calculator.
Calculator functions are described in detail in a later section. For more
information about the Calculator, see Using the Calculator.
Calculator Functions
| Button |
Menu Option |
Action |
 |
Scale |
Multiplies each point in the selected Worksheet record(s) by a specified constant. |
 |
Invert Trace |
Multiplies each point in the selected Worksheet record(s) by -1. |
 |
Shift Baseline |
Creates a DC offset by adding a specified constant to each point in the selected Worksheet record(s) |
 |
Remove Baseline |
Removes the DC offset |
 |
Zero Points |
Sets all points within a specified time range to zero |
 |
Crop |
Select a crop point for the selected record |
 |
Add |
Add two or more Worksheet records |
 |
Subtract |
Subtracts one Worksheet record from another |
 |
Average |
Computes the average of two or more Worksheet records |
 |
Time Align |
Lines up selected Worksheet records along the time axis |
 |
Time Shift |
Shifts the selected Worksheet record(s) along the time axis |
| Button |
Menu Option |
Action |
 |
Smooth |
Applies a smoothing algorithm to the selected Worksheet record(s) |
 |
Lowpass Filter |
Applies a low-pass filter to the selected Worksheet record(s) |
 |
Highpass Filter |
Applies a high-pass filter to the selected Worksheet record(s) |
 |
Bandpass Filter |
Applies a band-pass filter to the selected Worksheet record(s) |
 |
Notch Filter |
Apply a notch filter to the selected Worksheet record(s) |
|
Hanning Window |
Applies a Hanning window to the selected worksheet record for use with the magnitude spectrum |
|
Cosine^2 Window |
Applies a Cos2 window to the selected worksheet record (smoothes the start and end). Used with magnitude spectrum |
|
Mag Spectrum |
Generates an FFT of the data using 1024-8192 points per FFT |
|
Auto Cursor |
Applies the selected auto cursor to the selected worksheet recor |
Worksheet Functions
Located below the Calculator, the five Worksheet buttons can be used to format
and organize the Worksheet. These functions may also be found in the Worksheet
menu.
| Button |
Menu Option |
Action |
 |
Space Evenly |
Spaces all selected plots evenly throughout the Worksheet |
 |
Spread Apart |
Spreads all selected plots apart |
 |
Squash Together |
Positions selected plots closer together |
 |
Pile |
Piles all selected plots on top of one another |
 |
UnPile |
Unpiles all selected plots |
 |
Delete |
Deletes the currently selected Worksheet records |
The Worksheet
The Worksheet is an area of the main window where you can place records for
reporting. Calculator functions may also be applied to records in the Worksheet.
For more information about the Worksheet, See Using the Worksheet..
Customizing Your Display
BioSigRZ provides various types of visual data on one easy-to-use main window.
Depending on your data display needs and your type of monitor, you may find
it useful to alter the default BioSigRZ screen configuration. Some common
screen configuration problems and their solutions are listed below.
| Problem |
Solution |
| Plot text seems too big or too small |
Change the size of the font |
| Plots cannot be seen clearly against the plot background |
Change the plot background color and/or the plot color |
| One or more plot is not large enough |
Maximize the window and/or change one or more plot sizes |
| Multi-purpose plots cannot be differentiated from one another |
Change one or more plot colors |
To customize the Worksheeet:
To customize all other areas:
From either Display Options dialog box you may configure the font types and
sizes and colors using standard Windows techniques.
Customizing the Layout
You may wish to re-size screen display areas.
To manually customize a screen area:
- Drag one or more Sizing Bars until the desired size is reached.
Using Setups
You may configure up to three layout setups.
To use a setup:
- Select the desired Setup # by hovering over the Layout option in the Setup menu.
To configure a setup:
-
Select the desired Setup # by hovering over the Layout option in the Setup menu or
click the desired Setup #
button.
-
Ensure that the desired Setup # is currently unlocked prior to any modifications.
To do this, click the Lock button if it is
currently  enabled.
-
Manually customize the layout.
-
Select Lock by hovering over the Layout option in the Setup menu or click the Lock
button. This layout is now associated with the
chosen Setup #.
Returning to the Default Layout
To return to the default layout:
- Select To Default hovering over the Layout option in the Setup menu or click the
Default Layout button.
Customizing Cursor Strings
BioSigRZ provides a means for placing cursors in history/worksheet records. This
process is known as Cursor Editing.
When a history or worksheet record is selected for Editing, it is possible to
place up to 10 cursors within the signal. Each cursor is associated with a text
label. You may customize the first five labels. These labels are known as cursor
strings.
To customize a default cursor string:
Cursor strings may be defined as follows:
To specify one set of cursor strings for all acquisition channels:
-
Check the One Set Only check box.
-
Type in the desired cursor strings.
-
Click OK.
To specify one set of cursor strings for each acquisition:
-
Make sure the One Set Only check box is not checked.
-
Select the desired acquisition channel.
-
Type in the desired cursor strings.
-
Click OK.
-
Repeat for each acquisition channel.