DPOAE Measurements with the RZ6
Introduction
This guide is primarily intended for researchers who are new to collecting DPOAEs using a TDT RZ6/BioSigRZ system. It brings together targeted information from our software and hardware manuals and goes beyond product specific details to answer common questions, including subject or test area considerations that might affect your testing. The information provided is based on our knowledge of the TDT system and years of experience helping our users. It's not intended to favor or dictate any particular experimental protocols, methods, or research goals.
We leave the science up to you, but we're here to support you on your way to successful experiment completion.
Organization of the Guide
This guide begins with a general overview of DPOAEs; what they are, how they're used, and what type of response signal to expect. It discusses the various aspects of your experiment such as test subjects, your test area, and the hardware and software you will use.
It includes detailed information about important tasks including:
DPOAE Overview
Distortion product otoacoustic emissions (DPOAE) are generated in the cochlea when the outer hair cells amplify and propagate particular sounds along the basilar membrane in response to two tones separated by a fixed ratio and played from separate sound sources (or speakers). DPOAE can be measured from the external auditory canal, making them an efficient screening and diagnostic tool in the study of hearing and hearing loss. Researchers who study DPOAE are interested in the energy or power of the Distortion Product as a function of the power of the sound sources.
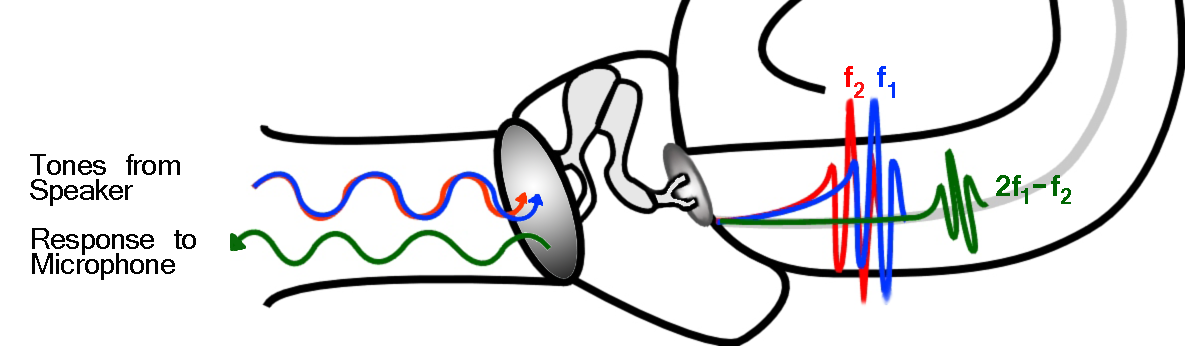 |
| DPOAE Ear Diagram |
The test stimulates the cochlea using two simultaneous continuous pure tones (F1 and F2) from separate sound sources and that differ by 20%, or you can say they have a frequency ratio (FR) of 1.2. As depicted in the DPOAE Ear Diagram above, the response from the cochlea is continuous during the stimulation. A microphone is enclosed with the speaker tubes in the ear canal. It records the sound pressure changes in the ear canal and streams a continuous voltage back to the recording system. The microphone detects all signals present in the ear canal. This includes both stimulation tones generated by the speakers, background noise, and any DPOAE response waveforms generated by the cochlea, all summed together.
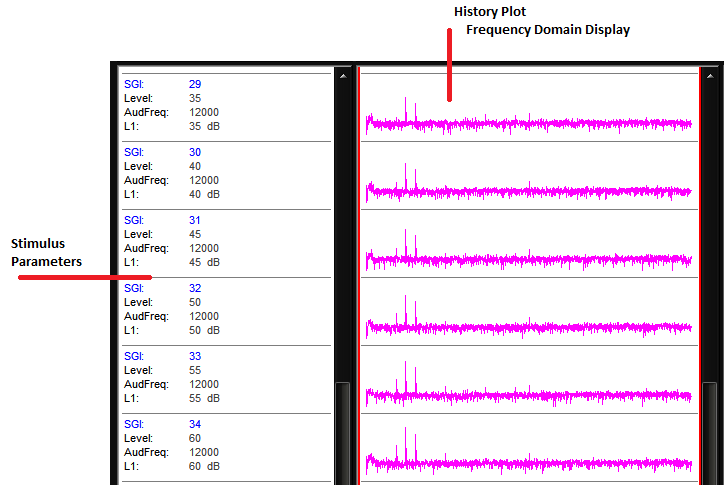 |
| Averaged DPOAE Response Waveforms |
Standard DPOAEs measure the levels of the stimulation tones and the level of the cochlea response, which is one of many generated during stimulation. A harmonic is a frequency component of a signal that is an integral multiple of the signal's fundamental frequency. To separate out the energy of these unique frequencies (two tones and a harmonic cochlea response), the Time Domain signal is converted to a frequency domain signal that displays the amount of energy each frequency contributes to the acquired waveform. When we isolate the information we're looking for we can easily compare responses. The DPOAE measurements are repeated a number of times and averaged together into the final frequency domain plot for a desired stimulation level and frequency combination.
Note
Values in BioSigRZ are inherently dBV. You can convert this in the Acquisition settings or, for a quick approximation of the dB SPL value, you can add 120. Also see Converting dBV to dB SPL.
We know the F1 and F2 signals that we stimulate at, so we can easily find these on the x-axis and mark their y-axis levels on the plot. We also know the frequency that we expect the cochlea to respond at, so we can mark that level as well. Marking these frequencies and levels across various stimulation frequency combinations forms a DP-gram. Some researchers are also interested in varying the stimulation levels. As the stimulus levels are reduced the response is also reduced. The DP-gram shows the 'threshold' or the point where the DP can no longer be detected from the noise of the microphone.
DPOAE Recordings
The TDT system for DPOAE recording features the RZ6 processor that brings together stimulus production and data collection on a single device and under a single clock for precise timing. The BioSigRZ system software for experiment control and data visualization is PC based and is more flexible than clinical systems while still easy to use. DPOAE recordings do not need a quiet environment. You can easily record DPOAE on a bench without sound attenuating chambers, but this is optional.
The diagram below shows a typical DPOAE system. Each part of the system will be discussed in more detail as you read through this guide.
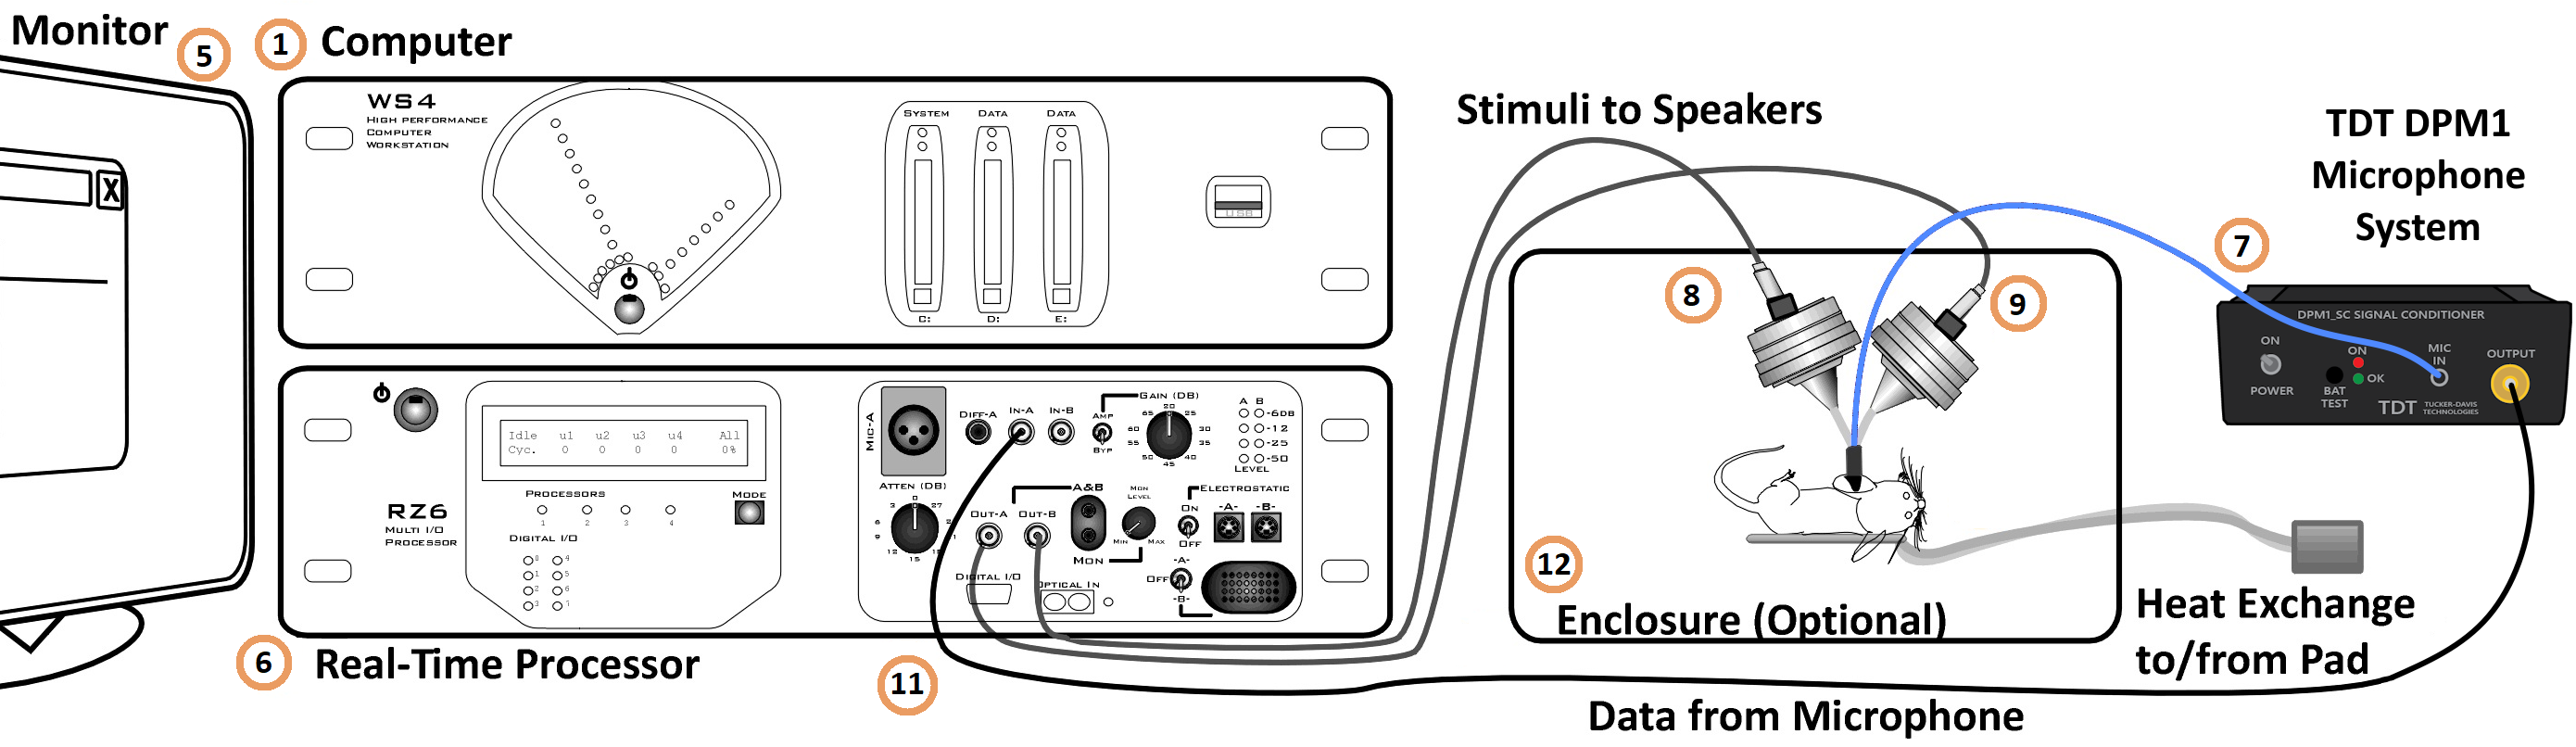 |
| Typical System Using TDT's RZ6 Processor and MF1 Speakers |
What you'll need:
-
Windows computer (WS4 shown)
-
Optibit interface (installed in computer)
-
TDT Drivers (software installed on computer)
-
BioSigRZ (software installed on computer)
-
Computer monitor
-
Multi I/O Processor with optic port (RZ6-A-P1)
-
TDT microphone system (DPM1)
-
Speaker (MF1)*
-
Speaker (MF1)*
-
Calibration microphone (PCB-378C01) (not shown)
-
Cable kit (BNC-ABR)
-
Sound attenuating subject enclosure (optional)
-
Heating pad (optional)
-
Subject
-
Anesthesia (not shown)
Note
* EC1 Electrostatic speakers may also be used for higher frequency studies.