Working with the Complete Signal
You can view the final waveform and preview the signal after you have defined all signal-level, segment-level, and component-level parameters.
Displaying the Signal
The overall signal is displayed in the Signal window.
To view the overall signal:
- Return to the main SigGenRZ window.
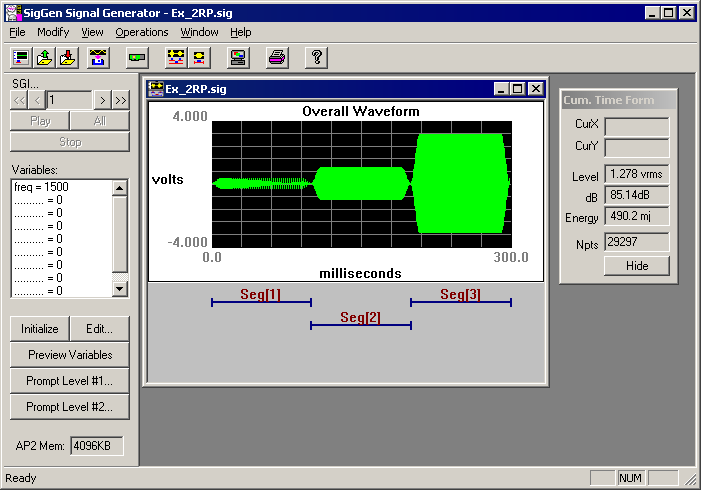
When you click OK to return to the current Signal window from either Signal Parameters or Edit Signal Segments window, SigGenRZ will automatically update all parameters and the overall signal waveform. The Signal window displays the time-varying waveform of the current segment and the x-axis is measured in milliseconds. The y-axis is measured in Volts. If you have defined/modified a variable file, you may click on the Initialize button to read in all variable values and recalculate the waveform.
X-Axis: By default, values of the x-axis extend from 0 to the number of milliseconds defined in the Duration field of the Signal Parameters window.
Y-Axis: SigGenRZ automatically scales the y-axis so that the peak Voltage of the signal is displayed. The origin of the y-axis is always 0 Volts.
Note
The RZ6 D/A converters limit the Voltage range to ±10 V. The Signal window limits the displayed Voltage to this range. If there are points of which the calculated values are greater than ±10 V, you will spot clipping from this display. When this happens, if you are concerned, you may change either the segment levels or component levels.
Using Cursors
It may be desirable to look at the details of a small signal portion, or obtain information on specific point. You can zoom-in on a portion of the overall signal or place a cursor on a specific point in the overall signal.
Zoom-In
To zoom in:
-
Place the mouse at the right or left edge of the desired area of the Signal window.
-
Hold down the left mouse button.
-
Drag the mouse over the desired area.
-
Release the left mouse button.
The window will now display the desired section.
To return to the default display:
- Click the right mouse button anywhere in the Signal window.
Crawling
You can "crawl" through a zoomed-in time-domain waveform. Crawling will scroll the display through the waveform.
To crawl to the right:
- Click the left mouse button in the right portion of the display window.
To crawl to the left:
- Click the left mouse button in the left portion of the display window.
Placing a Cursor
You can obtain information about a specific point in the Signal window by placing a cursor with the desired display. This information is displayed in the Cumulative Time Form, as described on the next page.
To place a cursor:
-
Hold down Shift and click the left mouse button.
-
Drag the cursor left or right to the desired location.
The Cumulative Time Form
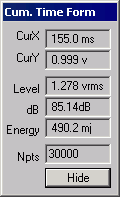
The Cumulative Time Form (or Cursor Box) displays information about the current signal or portion of a signal. It is displayed by default when SigGenRZ opens, but may be hidden at any time.
When there is no cursor in the signal waveform, CurX and CurY in the Cumulative Time Form will be empty.
To display the Cumulative Time Form:
- Select Cursor Box from the View menu.
SigGenRZ allows you to place a cursor within the displayed signal.
CurX: The x-axis (time) value of the cursor, in milliseconds (ms)
CurY: The current y-axis value at the cursor, in Volts
Level: The root mean squared (RMS) value of the displayed signal measured in Volts
dB: The average level, in dB Volts, of the currently displayed signal
Energy: The total energy of the displayed signal, in millijoules (mJ)
Npts: The number of sampling points contained in the displayed signal waveform
Hide: Click to hide the Segment Time Form. You may display it again by selecting Cursor Box from the View menu of the main window. You can also hide the Cumulative Time Form by clicking Cursor Box on the View menu.
Previewing the Signal
While SigGenRZ can design signals for a variety of purposes, many users will wish to design stimulus signals for experiments. Often, these experiments will require the repeated presentation of the stimulus signal through multiple intervals. Signal parameters may be varied from one interval to another during the experiment. SigGenRZ provides a means for previewing (listening to) the signal through all intervals, or SigGen Indexes (SGIs).
The SigGen Index
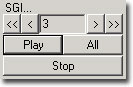
By setting the SigGen Index (SGI), you can play one selected interval of your signal or play all intervals of your signal.
Note
When SigGenRZ is started and it cannot find the RZ6 device (the hardware may not be turned on), it will still run but the above three buttons will be dimmed and not be available for signal preview.
You can preview a specific interval, n, of the signal by setting the value of the SigGen Index equal to n. This is most useful if at least one signal parameter will vary from one interval to another. Boundary control applies to this SGI display, so if your variables are limited by a boundary, you can only change SGI in the range to view the signal.
![]()
![]() Lowers/raises
the SigGen Index in increments of 1.
Lowers/raises
the SigGen Index in increments of 1.
![]()
![]() Lowers/raises
the SigGen Index in increments of 10.
Lowers/raises
the SigGen Index in increments of 10.
Previewing
Play
Clicking the Play button plays interval n of the signal where n is the number specified in the SigGen Index field (the currently displayed signal).
All
Clicking the All button plays all specified intervals of the displayed signal. When All is clicked, SigGenRZ will initialize all variables, recalculate the entire waveform, and present every signal interval as SGI increments. A next interval is calculated when the previous interval is played, so the signal intervals will not be presented continuously.
The delay between intervals is determined by the time SigGenRZ takes to calculate the next interval.
Stop
Clicking the Stop button stops the signal preview (either the Play or play All mode).