Working with Segments
After you have defined component parameters and created a segment, you may:
-
Modify segment parameters.
-
Obtain information about the segment's time-domain waveform.
-
Obtain information about the segment's frequency spectrum.
You may do these things from the Edit Signal Segments window.
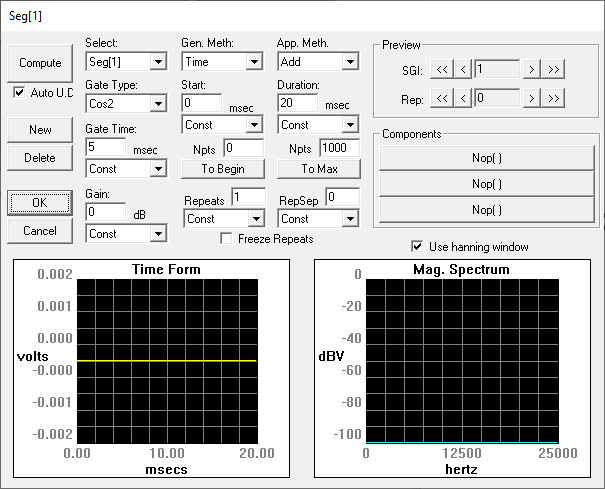
Computing Segments
As you modify segment parameters, you affect the characteristics of the segment waveform. SigGenRZ does not automatically regenerate the waveform every time you change a parameter. A recalculation and updating will be performed when you click OK to finish editing segments. It may be necessary to recalculate the segment while you modify the parameters. This can be done at various points in the modification process.

Compute
Clicking the Compute button recalculates the segment based on the currently specified parameters.
Auto Update
You may wish to have SigGenRZ automatically recalculate segments when a parameter value is changed. When Auto U.D. is checked, the segment is automatically recalculated whenever you move the focus from a field that has been updated.
The following are examples of situations where recalculation would occur:
-
You edit a parameter and then TAB to another field.
-
You edit a parameter and then click in another field.
-
You select a new parameter from a list.
After you have created a segment, SigGenRZ displays the time-domain waveform in the Time Form window. The magnitude spectrum of the segment is displayed in the Magnitude Spectrum window.
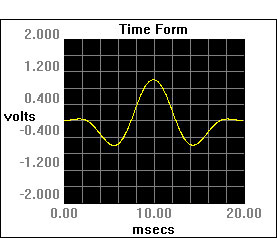
The Time Form Window
The Time Form window displays the time-varying waveform of the current segment. The x-axis is measured in milliseconds. The y-axis is measured in Volts.
X-Axis: By default, values of the x-axis extend from 0 to the number of milliseconds defined in the Duration field of the Edit Signal Segments window. You may use cursor to zoom-in to display details.
Y-Axis: SigGenRZ automatically scales the y-axis so that the peak Voltage of the signal is displayed. The x-axis is always centered at the y-axis (0 Volt horizontal line). The y-axis is always placed at the left boundary of the time plot.
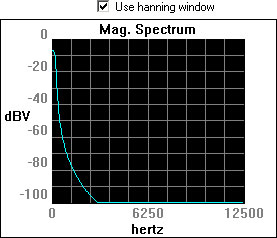
The Magnitude Spectrum Window
The Magnitude Spectrum window displays the frequency domain values of the segment. The x-axis is measured in Hertz. The y-axis is measured in dBV (decibels in Volts). The reference value for dBV is user defined. See Calibration for more information.
X-Axis: The x-axis extends from 0 Hz to the Nyquist frequency based on the current sample period.
Nyquist frequency (Hz) = 1/sample period (seconds) * 1/2
Y-Axis: SigGenRZ automatically scales the y-axis so that the maximum value in dBV can be displayed clearly.
Using a Hanning Window
You may apply a Hanning window to the frequency domain signal by checking the Use Hanning Window box.
Using Cursors
You may wish to focus on a portion of either the Time Form window or the Magnitude Spectrum window. SigGenRZ provides two types of cursor functions that you can use to zero-in on specific areas of the display.
Zoom-In
You can zoom-in on a section of either the Time Form window or the Magnitude Spectrum window.
To zoom in:
-
Place the mouse at the right or left edge of the desired area of either the Time Form window or the Magnitude Spectrum window.
-
Hold down the left mouse button.
-
Drag the mouse over the desired area.
-
Release the left mouse button.
The window will now display the desired section.
Note
When you zoom-in on a Time Form window, the Magnitude Spectrum window is automatically recalculated to reflect the new spectrum of the zoomed-in section.
To return to the default display:
- Click the right mouse button anywhere in the display window.
Crawling
You can "crawl" through a zoomed-in time-domain waveform. Crawling will scroll the display through the waveform.
To crawl to the right:
- Click the left mouse button in the right portion of the display.
To crawl to the left:
- Click the left mouse button in the left portion of the display.
Note
The magnitude spectrum will be automatically recalculated to reflect the energy represented in the portion of the signal that is displayed in the window.
Placing a Cursor
You can view information about a specific point in either the Time Form window or the Magnitude Spectrum window by placing a cursor within the desired display. The information will be displayed in the Segment Time Form, described on the next page.
To place a cursor:
Place the mouse pointer in the desired display window.
-
Hold down Shift and click the left mouse button.
-
Drag the cursor left or right to the desired location.
The Segment Time Form
The Segment Time Form displays information about the current segment or portion of a segment and may display information about either the Time Form window or the Magnitude Spectrum Window.
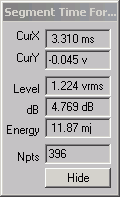
CurX: The x-axis (time) value at the cursor, in milliseconds (ms)
CurY: The current y-axis value of the signal at the point of any cursor, in Volts
Level: The root mean squared (RMS) value of the signal as measured in Volts
dB: The level in dB Volts of the currently displayed signal
Energy: The total energy of the displayed signal, in millijoules (mJ)
Npts: The number of sampling points contained in the displayed time signal waveform.
Hide: Clicking the Hide button causes the Segment Time Form to be hidden. You may display it again by selecting Cursor Box from the View menu of the main window.
Previewing Segment Intervals
Individual segment can be previewed in the Time Form and Magnitude Spectrum windows of the Edit Signal Segments window. Using SGI you can preview the segment in any interval of the signal.
Specifying the SigGen Index
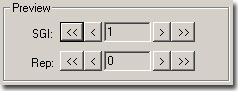
SigGen Index
The SigGen Index (SGI) field specifies the specific interval you wish to preview. Since variable SGI is defined in Edit Signal Parameters window, boundary control is not applied to the SigGen Index here. In other words, you can increment SGI beyond its actual value. In this case, the last variable values will be used to compute the waveform.
![]()
![]() Lowers/raises
the trigger tick in increments of 1.
Lowers/raises
the trigger tick in increments of 1.
![]()
![]() Lowers/raises
the trigger tick in increments of 10.
Lowers/raises
the trigger tick in increments of 10.
Note
The Rep. Field is not supported at this time.