Workspace Basics
About the Workspace
OpenExplorer provides an interactive workspace that allows users to explore the relationships between recorded data, stimulus parameters, and other defined events. The workspace includes a plot area and two collapsible sub windows: the Tank Navigator and the Control Panel. Commands are available from the menu bar, the toolbar, or context sensitive (right-click) menus.
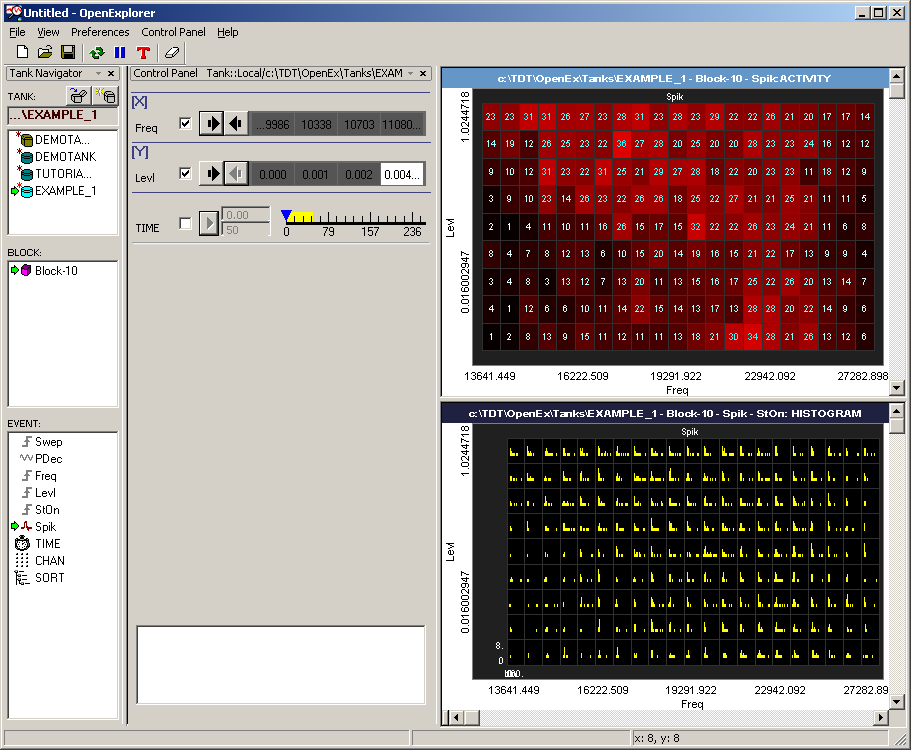
Tank Navigator
The OpenExplorer Tank Navigator is similar to the Tank Select (Tank Navigator) window in OpenScope. Users can select the data to be plotted by selecting a data tank and block. Once the data set has been selected, users can drag events to the plot area or Control Panel to configure the plot. The Events list displays events that were acquired as OpenWorkbench Stores as well as several standard events (Time, Chan, and Sort). Users can also drag a block to the plot area to display new data using a plot that has already been configured.
Control Panel
The Control Panel allows the user to define the plot axes or filter the data dynamically. The Control Panel always includes an XY Axis Control. The user establishes the plot axes by dragging the desired events from the Event list to this preset control. Additional controls can be added to further filter the data set. Controls are added by dragging an event to the control panel. A Control Configuration dialog is automatically opened for every added control to allow the user to determine the type of control and to configure other aspects of the control behavior. Filters in the Control Panel are always applied with AND logic (each new filter further limits or reduces the data viewed). A text entry area at the bottom of the Control Panel allows users to manually set filters with more complex logic.
Plot Area
The plot area displays the selected data after the filters have been applied. Several plot types are available, including activity, pile, or histogram plots. The plot area can be subdivided to allow the user to view the data set in several plot types at the same time and individual cells can be launched in separate sub-windows for further exploration. A data table view is also available. The plot area also displays information about the data being displayed.
Using the Tank Navigator
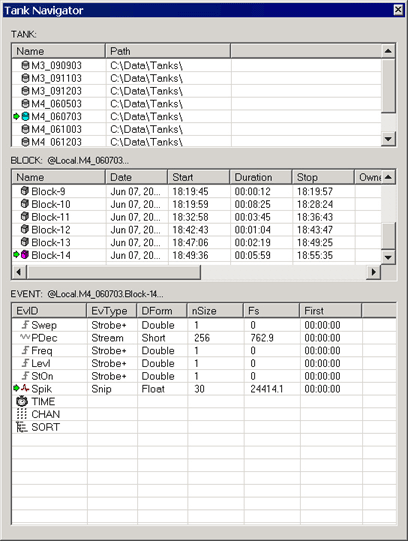
The Tank Navigator is used to select data in OpenExplorer. The window is divided into three interdependent areas: TANK, BLOCK, and EVENT. When the window is fully expanded, detailed information about tanks, blocks, and events enables users to select desired data for visualization and analysis. Clicking an object in any area selects the object. Right-clicking an area displays a shortcut menu that includes common commands for that area.
TANK
The TANK area lists registered tanks stored in the current data tank format. The right-click shortcut menu provides commands to browse for an unregistered tank or to display legacy format data tanks in the list. The Details view displays the name and path for each tank.
BLOCK
The BLOCK area displays the blocks available in the tank selected in the TANK area. The Details view displays a name, date, starting time, duration, stop time, owner, and memo area for each block of data in the selected tank.
EVENT
The EVENT area displays information about events for the block selected in the BLOCK area. This list includes user defined data Stores (defined in OpenWorkbench) and standard events such as Time (timestamp), Chan (channel number), and Sort (sort code).
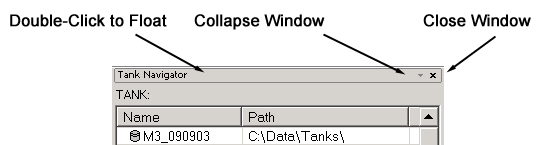
The Tank Navigator is a collapsible sub-window that can be hidden, moved, or resized to suit the user's needs.
Using the Setup Properties Dialog Box
The appearance and behavior of each plot can be modified using the Setup Properties dialog box. The Setup Properties dialog box contains all of the customizable settings for a selected plot.
While all Setup Properties dialog boxes look and behave in a similar fashion, the settings available depend upon the plot being modified. Most plot settings are similar to those available in OpenScope. See the OpenScope Plot Settings Reference for more information on plot settings.
To open the Setup Properties dialog box for a plot:
-
Double-click the plot.
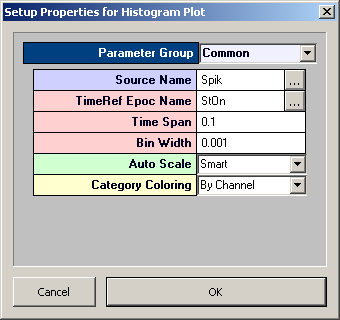
Plot settings are grouped into parameter groups. The Setup Properties dialog box opens with the most commonly used settings for the selected plot displayed.
To display the settings available in another group:
-
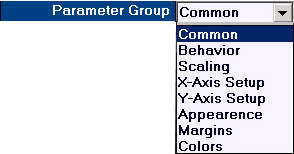
Click the Parameter Group value box and select the group from the list.
Source and Reference Epoch Settings
When settings, such as Source Name, must be set using the name of an event, a Lookup button
 is located to the right of the value box. Clicking the Lookup
button opens an Event Selection window.
is located to the right of the value box. Clicking the Lookup
button opens an Event Selection window.
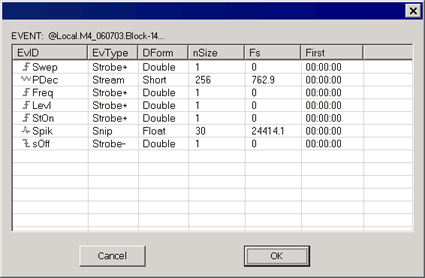
In the Event Selection window, a list of available events in the current block is displayed.
Events are organized in rows. The EvID (event ID) corresponds to the OpenWorkbench Store name or
Tank Code (for secondary tags). The event ID is preceded by an icon to indicate the type of
event, such as snippet or continuous waveform. Epoch events are marked with the
 Epoch icon.


