Dynamic Filtering and Analysis
About Filtering
OpenExplorer's feature rich, interactive Control Panel makes it possible to explore the relationships between recorded data, stimulus parameters, and other defined events dynamically. Stored variable events are selected from the Tank Navigator then added to the Control Panel to configure the x and y axes and implement data filters. The Control Panel taps into the powerful data sorting capabilities provided by the TTank data server, allowing users to sort through complex data sets quickly.
Note
Before configuring the x and y axes or implementing filters, the data event to be plotted should be defined. See Creating a Plot.
Configuring the X and Y Axes
The XY Axis control is a special type of filter that is always included in the Control Panel; however, users must configure this control by assigning a standard or stored scalar event for each axis.
To define the x or y axis:
-
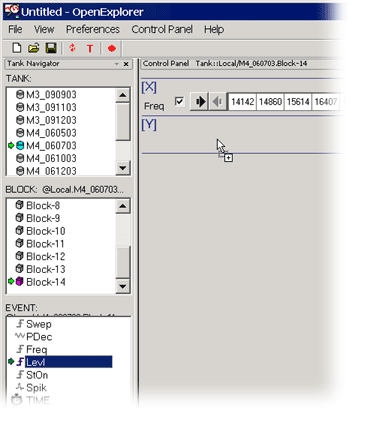
Drag the desired event to the [X] or [Y] bar in the Control Panel.
-
A configuration window is opened. In the Control Configuration window, you can modify settings such as the display precision, text label, and values to be included. To learn more about the configuration options see Control Configuration Dialog Box.
-
Click OK.
Using the X and Y Axes to Filter Data
The XY Axis control is automatically configured as a multi-select filter. This gives the user a great deal of control over exactly what data is displayed. Using the control, users can select specific values to include or exclude in the XY Axis configuration, view a specific range of values, group values in linear or logarithmic bins, or create custom groupings using logical operators in text based filters.
Warning
Always keep in mind that the multi-select control type is limited to 100 selections. If the desired event includes more than 100 values, by default, the first 100 values will be used.
Creating the XY Grid Using a Single Event
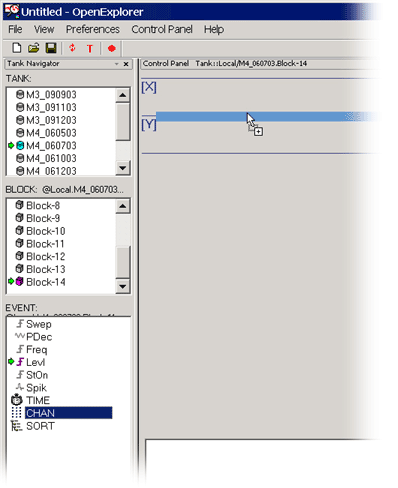
A single event can be split across the x and y axes. CHAN, for example, is a standard event that stores the acquisition channel number associated with each event in the tank. Chan can be split across the x and y axes to represent electrode array geometry. This can be accomplished by dragging the event to the border between [X] and [Y] or using the Add XY Axis Control command on the Control Panel menu.
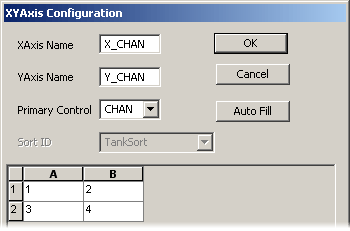
The XY Axis Configuration dialog box provides additional control over the arrangement of values. In the XY Axis Configuration dialog box you can type a label for the x and y axes and select the event from the Primary drop-down menu. A spreadsheet-like grid is automatically generated based on the selected event. The cell values can be edited by typing directly in the cells; however, no error checking is provided. The user must ensure that a valid value is entered.
Note
This dialog box is available from the Add XY Axis Control command on the Control Panel menu.
The grid geometry can be changed in the Auto Fill Configuration, which is available from the Auto Fill button.
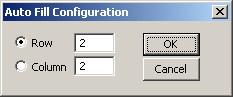
To change the number of rows or columns:
- Type the new value in the corresponding box and click OK.
Adding Filters
OpenExplorer makes it easy to create complex filtering quickly and dynamically. Filter controls can be added by dragging an event from the Event list to the Control Panel. Each new filter is added (AND logic) to the existing filters. Filter information is displayed below the plot title in the plot area.
To add a filter:
-
Drag the desired event to the Control Panel.
-
In the Control Configuration window, you can modify settings such as the control type and values to be included. Begin by selecting one of four possible control types:
-
Next, modify the configuration settings as needed. To learn more about the configuration options see Control Configuration Dialog Box.
-
Click OK.
After a filter control has been created, a shortcut (right-click) menu is available with options to delete or configure (modify) the control.
Multi Select Filters

The multi-select option allows users to add controls in the form of a sorted list of values. For example, when a stimulus frequency epoch event is added as a multi-select control it appears as a sorted selection bar with each selection box representing a stimulus frequency value. When the default control configuration is used each value is represented by a single block (up to 100 selections) and the user can select or exclude individual values in this list. Excluding a value will result in the elimination of the events that occurred at that epoch value from the plot. The user can also define the filter in more detail in the Control Configuration dialog box. This achieves additional and highly specific filtering.
The Control Configuration opens automatically when a control is added. It can be reopened from a shortcut (right-click) menu. This menu can also be used to enable/disable, or remove a control. The control can also be enabled or disabled using the check box to the left of the control selection bar.
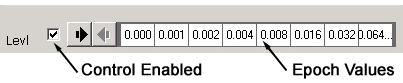
The XY Axis Control
The XY Axis Control is a special control that comprises two multi select filters. When dragging events, keep in mind that the Multi Select filter is limited to 100 selections. This means that the plot axis will be configured to display only the first 100 values when the default configuration settings (one value per selection box) are used. Users can select a different range of values or change the bin size (values represented by each selection box) to ensure that all desired values are included in the plot.
Viewing the Values
The Control Panel is a sub-window that can be resized by the user. The controls in the Control Panel are automatically resized to fit the available space. If there are more selection values than can be displayed, scrolling arrows are added to the control to allow the user to scroll right or left along the selection bar.

The Control Configuration dialog box enables the user to modify the control label, set selection box label precision, or display value units (such as K, M, p ...).
Filtering Values Using the Selection Bar
To remove responses for a particular value from the plot display, click the corresponding value on the selection bar. Multiple values can be selected for filtering. Values that have been removed are darkened to indicate that they are no longer displayed with the data.

Step Slider Filters
The step slider option allows the user to add controls in the form of a sorted list of values. The values are arranged on a slider, which can be stepped through one by one, either manually or automatically via a Play button. This is especially useful for viewing the data at single values of the event. Although it could be used to view the response of a cell at every value of, say, frequency, it is frequently used to view the data on each channel. It could also be used to view the response of each individual unit by adding the slider control using the sort code event. The user can also define the filter in more detail or change animation settings (such as animation speed or looping) in the Control Configuration dialog box. The Control Configuration opens automatically when a control is added. It can be reopened from a shortcut (right-click) menu. This menu can also be used to enable/disable, or remove a control. The control can also be enabled or disabled using the check box to the left of the control selection bar.
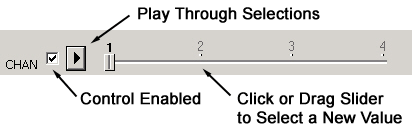
The Step Slider is limited to 100 slider positions. By default, the first 100 values are used. Users can select a different range of values or change the bin size (values represented by each slider position) in the Control Configuration dialog box.
Viewing the Step Slider Values
The Control Panel is a sub-window that can be resized by the user. The controls in the Control Panel are automatically resized to fit the available space. If there are more selection values than can be displayed, scrolling arrows are added to the control to allow the user to scroll right or left along the control bar.

The Control Configuration dialog box enables the user to modify the control label, set selection box label precision, or display value units (such as K, M, p ...).
Continuous Filters

Adding a continuous control results in a continuous scale with all the values (up to 500) of the event in ascending order. The user has control over two values, start and length. A blue arrowhead on the continuous scale represents the start value and the length is denoted by a yellow bar. The starting value can also be specified by clicking the arrowhead and dragging the mouse. The most common use of this type of control is to add Time as a continuous control. Data can be viewed in chunks of time defined by the start and duration values. A play button is also provided to allow viewing the data in successive chunks of time on the continuous timeline. Thus, continuous controls allow the user to play through all values in an animated plot. This is particularly useful when studying the effects of fatigue and boredom on the response of the cell.
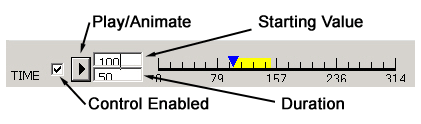
The user can also define the filter in more detail or change animation settings (such as animation speed or looping) in the Control Configuration dialog box. The Control Configuration opens automatically when a control is added. It can be reopened from a shortcut (right-click) menu. This menu can also be used to enable/disable, or remove a control. The control can also be enabled or disabled using the check box to the left of the control bar.
Adjust Epoch Filters

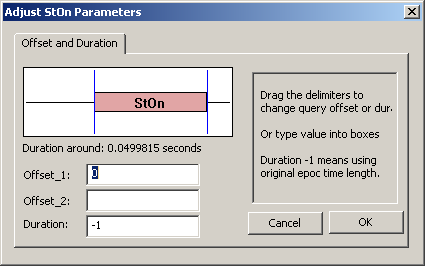
The Adjust Epoch control is used to build a time referenced epoch filter, that is, a filter based on (a) offset from the onset of the epoch and (b) duration. On creating this type of control, you will see the epoch event in the control area with two vertical bars that can be moved along the horizontal axis. The vertical bars can be dragged manually to specify offset and duration values. When this filter is enabled, only those values or data that fall within the bounds of this filter will be displayed. This feature is useful when you need to view data with respect to a certain event, such as stimulus. It is particularly useful for viewing pre, peri, or post-stimulus histograms.

A shortcut (right-click) menu can be used to enable/disable, or remove a control. The control can also be enabled or disabled using the check box to the left of the control bar. The Adjust Epoch control can only be selected when the event is initially dragged to the control panel. After it has been added, the standard Control Configuration dialog box is no longer available. Double-clicking the epoch will result in a window where you can specify the offset and the duration precisely.
Changing the Bin Size
In OpenExplorer Bin Size is closely tied to the Auto Fill feature for control configuration. The Auto Fill feature provides several options for setting bin size or users can choose to turn Auto Fill off and create bins manually in the control configuration spreadsheet. Bin size can be set when the control is added or modified later.
To set the bin size:
-
Open the Control Configuration dialog either by dragging an Event to the Control Panel or by double-clicking an existing control.
-
Click the Auto Fill Options button.
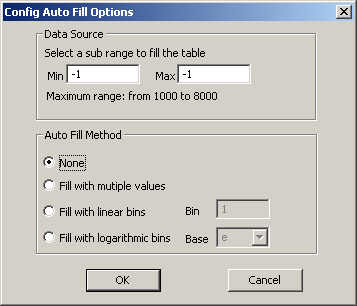
The Auto Fill Options dialog box opens, allowing you to determine how the control configuration spreadsheet will be filled.
-
If desired, set a range in the Data Source area of the dialog to change the range of values used to fill the spreadsheet.
-
Select an Auto Fill Method:
- None - This will allow you to edit the filter criteria manually in the control configuration spreadsheet.
- Fill with multiple values - This will create bins with one value in each bin.
- Fill with linear bins - Define a bin size in the box to the right.
- Fill with logarithmic bins - Define a bin size in the box to the right.
Note
Each method can only create a number of bins equal to or less than the maximum number of values supported by the control.
-
Click OK to close the Auto Fill Options.
-
-
Click OK to close the Control Configuration dialog.
Adding Sort Code Filters
OpenExplorer provides an Event labeled SORT which can be used to create a sort code filter control. Sort code filters may be initialized using a SortID (a set of sort codes that are defined for a block of data) or customized by manually entering a specified range of sort code values.
For all data sets, sort codes assigned during acquisition (online) are saved to the default SortID, TankSort. Sort codes can also be assigned offline using OpenSorter and saved to user defined SortIDs. Data sets can be sorted any number of times, resulting in sort codes stored to multiple SortIDs for each data set.
To create a SortID based Sort Code Filter:
-
Drag the event labeled SORT to the Control Panel.
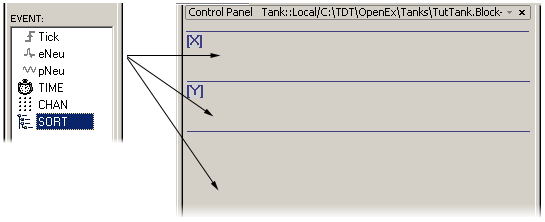
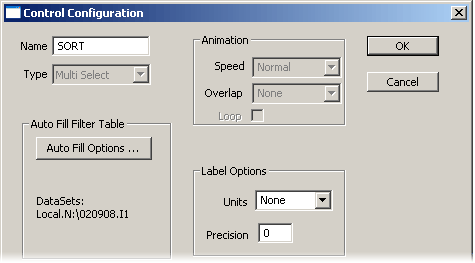
The Control Configuration dialog box opens.
Note
Dragging the SORT event to the X or Y axes will enable only the Multi Select control type in the Control Configuration dialog box. Dragging the SORT event below the X or Y axes allows different filter controls to be created such as the Step Slider or Continuous filter types.
-
Click the Auto Fill Options button.
-
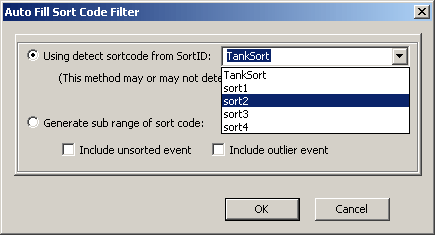
Click the Using detect sortcode from SortID radio button.
Note
OpenExplorer searches through the first 1000 events in the data set for sort codes when a SortID is used to auto fill the sort code range. If your data includes sort codes that appear only after the first 1000 events you can create a custom sort code filter instead.
-
Select the desired SortID from the drop-down menu.
-
Click OK.
-
The sort code range is auto filled according to the selected SortID.
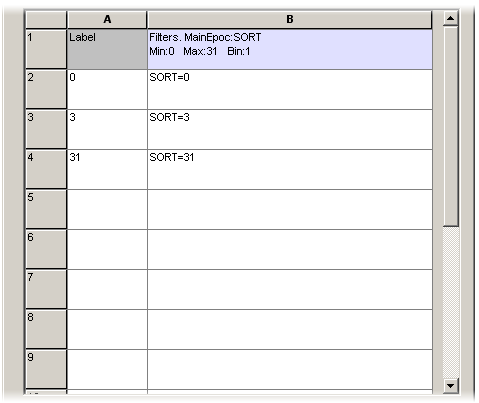
-
Click OK to accept the auto fill options and create the SORT control.

-
The Generate sub range of sort code option can also be used to auto fill any sort codes of your choice. This option is useful for large data sets (>1000 events) and can be configured to include any range of sort codes manually.
To create a Custom Sort Code Filter:
-
Drag the event labeled SORT to the Control Panel.
-
Click the Auto Fill Options button.
-
Click the Generate sub range of sort code radio button.
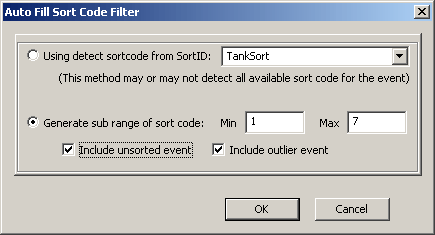
-
Enter the desired range (1 to 30) of sort code values.
Note
Any values entered here may later be removed, so if a unique arrangement of sort codes (e.g. 1, 3, 5, 10) is required select a range that encompasses all the desired values.
If needed, you may include the reserved sort codes of 0 (unsorted) and 31 (outliers) by checking either of the check boxes available.
-
Click OK.
-
The sort code range is auto filled according to the selected range and any selected checkbox options.
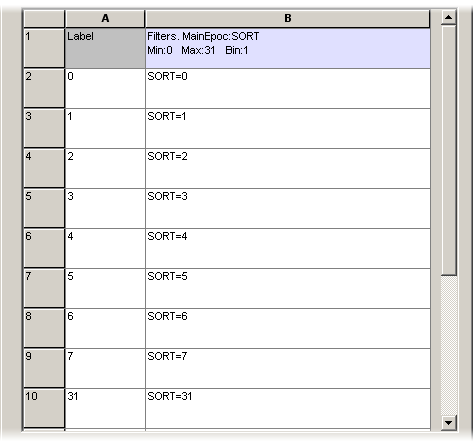
-
Sort codes may be removed by selecting them from the table and pressing the Delete key.
-
Delete any unnecessary sort codes and click OK to accept the auto fill options and create the SORT control.

Using the SORT Control
Once a SORT control is added the sort codes associated with your filter can be enabled/disabled.

A shortcut (right-click) menu can be used to enable/disable, configure, or remove a control. The control can also be enabled or disabled using the check box to the left of the control bar. Each box to the right of the checkbox represents a sort code.

The boxes are used to enable/disable a sort code and will show/hide any snippets that are associated with that sort code. The picture above will filter out any snippets that have a sort code of 0 or 2.
Entering Custom Filters in the Spreadsheet
OpenExplorer Auto Fill options provide several methods for automatically generating filter values. However, users can choose to turn Auto Fill off and create the filter criteria manually in the control configuration spreadsheet.
To create custom filters using the configuration spreadsheet:
-
Open the Control Configuration dialog either by dragging an Event to the Control Panel or by double-clicking an existing control.
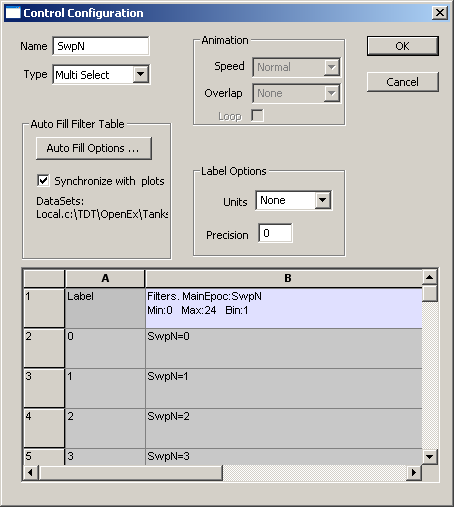
-
If needed, select the control Type.
-
Click the Auto Fill Options button.
The Auto Fill Options dialog box opens, allowing you to determine how the control configuration spreadsheet will be filled.
-
Click None. This will allow you to edit the filter criteria manually in the control configuration spreadsheet.
-
Click OK to close the Auto Fill Options dialog.
-
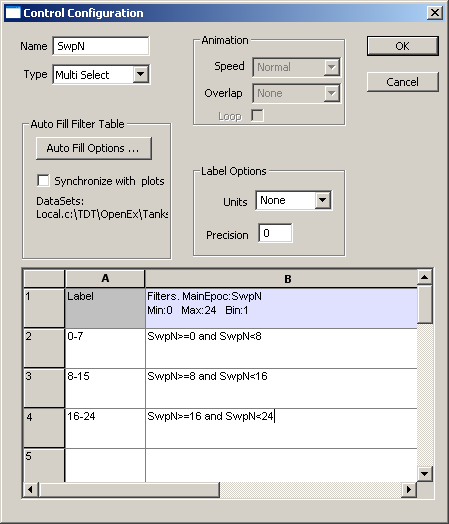
Clear the Synchronize with plots check box.
-
The editable cells in the spreadsheet will be empty and are colored white. Click in a cell to enter a value (such as Swep>=0 and Swep<100).
The header row contains the epoch name and min/max values for reference.
-
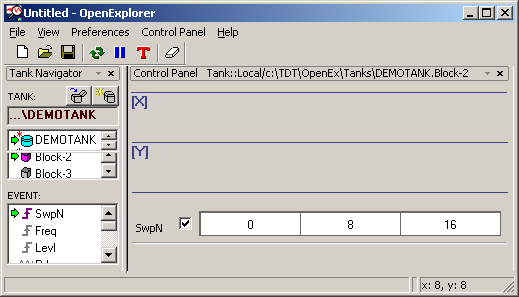
After you have entered all of the desired filter criteria, click OK.
Adding Filters in the Control Panel Text Box
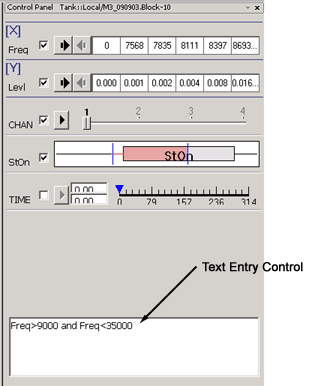
The control panel text entry box is provided to enable users to quickly apply filters through text entry. This is helpful when a quick arbitrary filter is needed (such as frequencies between 25 kHz and 35 kHz) or when the complex filter logic required can be implemented more quickly using text. The text entry box supports standard logical operators, such as: =, <, >, and, or, not. When text entry is used with controls, the text entry is treated as if it were a control; that is, all logic within the control is completed and the resulting filter is ANDed to other controls.
Text Filters in the Data Table
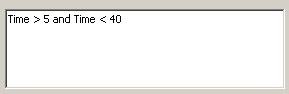
DataTable Query Conditions are provided to enable users to quickly apply filters through text entry. This is helpful when a quick arbitrary filter is needed (such as time stamp values between 5 and 40) or when the complex filter logic required can be implemented more quickly using text. The Filter Conditions box supports standard logical operators, such as: =, <, >, and, or, not.
To create a DataTable text filter:
-
Click the Text Filter Conditions Box and type the desired conditions.
-
Press Enter.
Enabling or Disabling Filters
After filters have been added they can be disabled by clearing the control's check box or using a shortcut (right-click) menu. Clicking the check box again will enable the control.

Finding Values in the Data Table
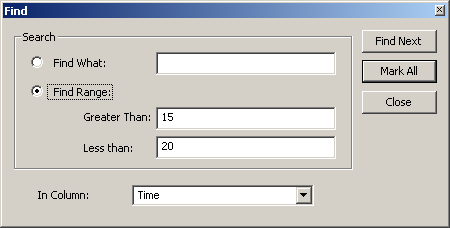
Depending on the filtering implemented and the data gathered, the Data Table might include many values or only a few. When the researcher is interested in a particular value or set of values, the Find feature can be used to quickly find or mark those values of interest.
To open the Find dialog box:
- Click the
 Find icon on the Data Table's toolbar.
Search
Settings in the Search area can be used to define the search criteria.
Find What: Click the radio button and type a value in the text box to define an exact value to match.
Find Range: Click the radio button and type a value in the Greater Than and Less Than text boxes to define a range of values to be matched.
In Column
This drop down menu is used to specify a particular column to search. This eliminates potential undesirable matches, such as the inclusion of matches based on ID number when the values of interest are a range of time stamp values. Select a column from the list or select Any to find the value(s) in any column.
Find Next
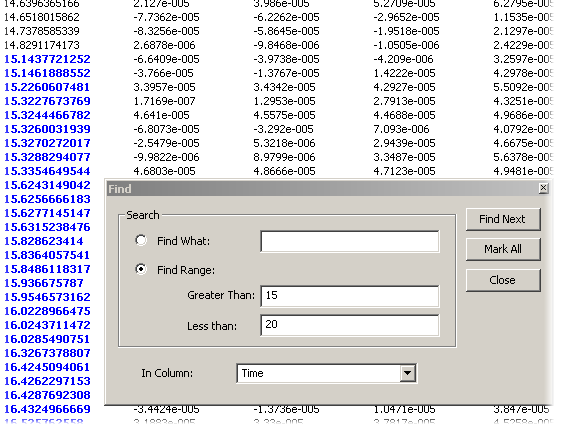
Click the Find Next button to locate the next value that matches your search criteria. This button can be used with a Find What or Find Range search. Each time the button is clicked and a value is found, the value is highlighted. The last found value will continue to be highlighted even after the Find dialog box is closed. To ensure that you will be able to identify matching values when searching through the data, use the Mark All feature.
Mark All
Click the Mark All button to mark all values that match the search criteria. These items are marked blue and remain colored until the Mark All button is used again or until the marks are cleared. Mark All can be used with Find What or Find Range.
Clearing the Marks
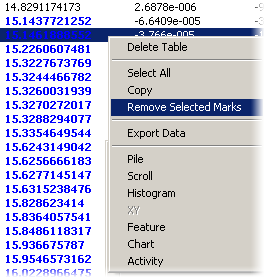
Marks can be cleared by clicking Remove Selected Marks on the Data Table shortcut (right-click) menu.