Exporting Data and Graphics
About Data Export
OpenExplorer provides several methods for exporting data and graphics.
- Exporting Data to CSV Format
- Exporting Data to TXT Format
- Cut and Paste OpenExplorer Data
- Exporting Graphics
Exporting Data to CSV Format
CSV files, sometimes referred to as flat files, contain values as a series of ASCII text lines. Typically, each line represents a row (or data record) and column values (or data points) are separated by a comma. In the OpenExplorer export, the user can choose to use a comma, space, or tab as the column delimiter. CSV files can easily be opened in Microsoft Excel.
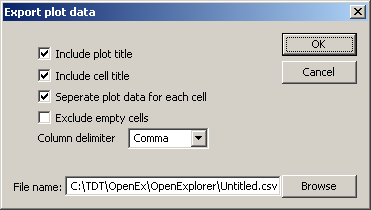
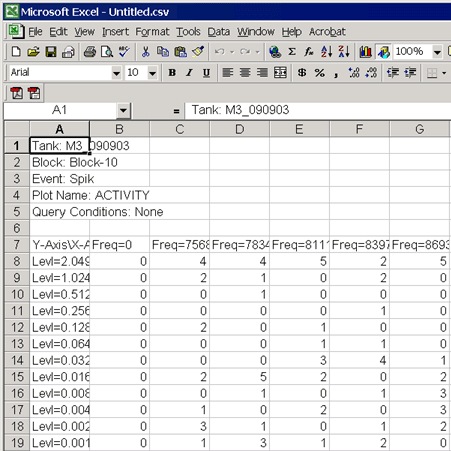
OpenExplorer supports exporting data directly from the plot area to the common CSV format. The data exported differs by plot type. For example, the activity plot export does not include any waveform data. Instead, it includes only counts of responses in each plot cell. The pile plot export includes the waveform data for each response in a plot cell. This export feature is available from the plot area shortcut (right-click) menu.
To export plot data:
-
Configure the plot and all filters.
-
Right-click the plot and click Export plot data on the shortcut menu.
-
Choose the desired export options.
-
Enter or browse to a path and file name for the data file.
-
Click OK.
-
Open the file in software, such as Microsoft Excel, that supports the .CSV format.
Exporting Data to TXT Format
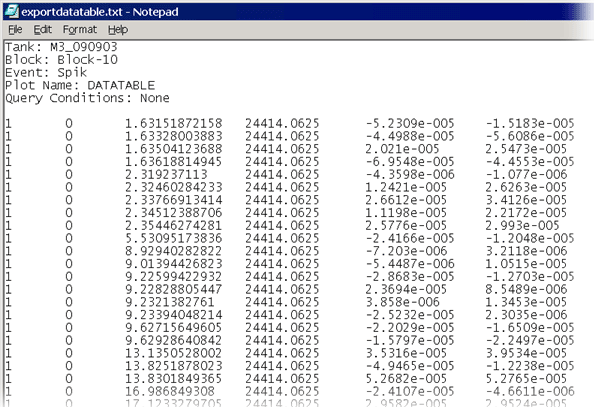
Data stored in a txt format can be opened in or imported by a wide variety of analysis applications. OpenExplorer supports exporting to this format from the Data Table. Like the export plot data (csv format) method, this export feature allows the user to determine the delimiter to be used and whether or not header data and/or event data is included in the export. This export method also allows the user to decide if fields such as Channel, Sort Code, and TimeStamp will be included.
To export from the data table:
-
Configure all filters.
-
Click the
 Export button on the Data Table toolbar. The
Export Data Configuration dialog box opens.
Export button on the Data Table toolbar. The
Export Data Configuration dialog box opens.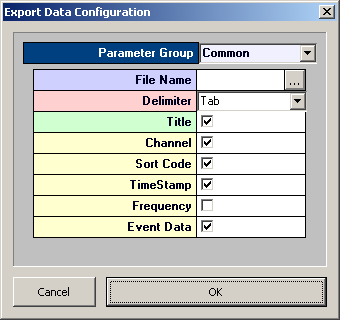
-
Click the
 Look-up button to the left of the File Name
box, to open the Save As dialog box.
Look-up button to the left of the File Name
box, to open the Save As dialog box. -
Browse to the desired file location, enter a file name, and click Save.
-
Choose the desired export options.
-
Click OK.
-
Open the file in software, such as Notepad, that supports the .txt format or import the file into the analysis software of your choice.
Cut and Paste OpenExplorer Data
The OpenExplorer Data Table supports a quick and easy copy and paste function. This feature allows users to select, copy, and paste data into a program such as Microsoft Excel. Pasted data can be used to quickly create diagrams for further exploration of the data but does not include header information.
Data Selection
Data must be selected by rows. Rows can be selected by clicking a row header. Use Shift+Click to select adjacent rows and Ctrl+Click to select non-adjacent rows. To quickly select all rows, right-click the data table and click Select All on the shortcut menu.
Copy Data
Selected data can be copied using the Copy button on the data table toolbar, from a shortcut menu, or using a standard Ctrl+C key press combination.
Paste Data
After data has been selected and copied, simply open up the intended application and use its paste method or the standard Ctrl+V key press combination.
Exporting Graphics
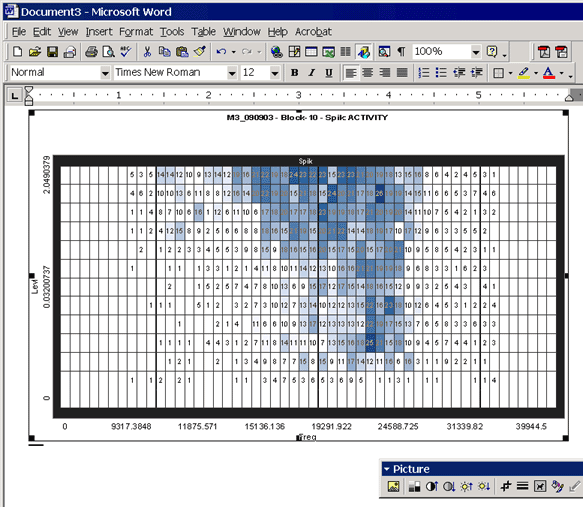
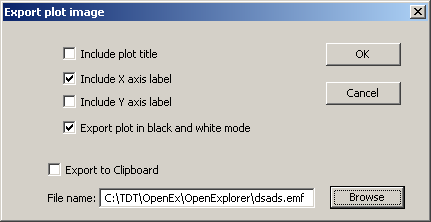
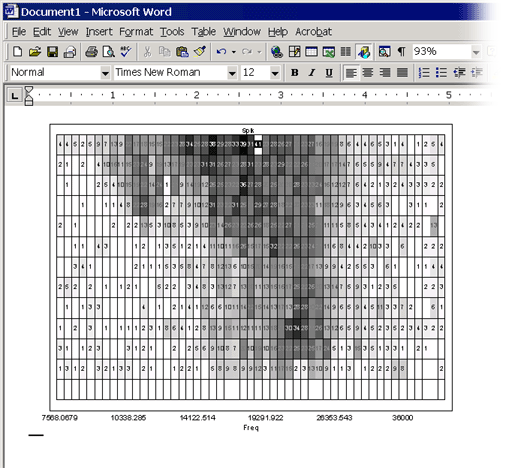
OpenExplorer provides several methods of exporting plots for use in end user documents. Plots can be copied to the Windows Clipboard or exported to a Windows metafile (.emf or .wmf). The shortcut menu in the plot area provides a quick and easy copy and paste method while the File menu export command gives users more control over the export process. Users can choose to copy the image to the Windows Clipboard or export to a file. Users can also choose to include axis labels, plot title, or to export in black and white mode.
To export a plot graphic using the shortcut menu:
-
Configure the plot and all filters.
-
Right-click the plot and click Copy plot picture to clipboard on the shortcut menu.
-
Switch to the destination software, such as Microsoft Word, Microsoft Paint, or Adobe Photoshop.
-
Paste the image (Ctrl+V) into the destination document.
To export a plot graphic using the File menu:
-
Configure the plot and all filters.
-
Click the File menu and click Export Image of the Active Plot.
-
In the dialog box, choose the desired options.
Note
To enable the File box and Browse button, clear the Export to Clipboard check box.
-
Click OK.
-
If you choose to export to the Clipboard:
-
Switch to the destination software, such as Microsoft Word, Microsoft Paint, or Adobe Photoshop.
-
Paste the image (Ctrl+V) into the destination document.
-
-
If you choose to export to a file:
-
Switch to the end document, such as Microsoft Word, and insert the picture file using that application's insert feature.
For example, in Microsoft Word, click the Insert menu, click Picture, and click From File. Browse to the picture, select it, and click Insert.
-