Selecting Data
Before data can be plotted, the tank and block containing the data must be selected using the Tank Navigator window. The window is divided into three interdependent areas: TANK, BLOCK, and EVENT. Clicking an object in any area selects the object and updates dependent areas.
Dragging Events
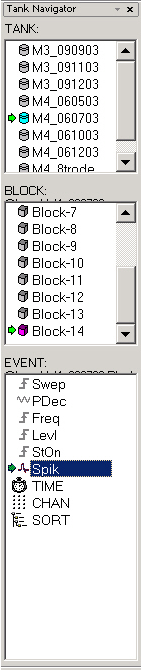
The Event list allows the user to configure the plots and filters quickly and easily.
There are three ways that events can be used:
- Dragging an event to the plot area generates a plot using that event data.
- Dragging an Epoch, Channel, or Sort event to the XY Control in the Control Panel defines a plot axis and allows the user to filter data based on that event.
- Dragging an Epoch or Standard event to an empty area of the Control Panel generates a new filter that will be applied to the data being plotted.
When an event is dropped into a plot or control, OpenExplorer automatically launches the appropriate configuration dialogs.
Dragging New Data to the Plot Area
After a plot has been configured, users can select the tank and block in the Tank Navigator then drag the block to the plot to view new data using the existing plot. Keep in mind that the selected tank and block must include the events used to generate and configure the plot and filters.
By default, all controls are configured to automatically synchronize with the plotted data set. This means that when new data is dragged to the plot, the control values (including x and y axes) will automatically be updated to reflect the values available in the new data set.
For example, a filter is created using the event Levl and the values for Levl are 2, 3, and 4 in the current data set. New data is dragged to the plot. The new data includes the event Levl but the values for Levl are 3, 4, and 5. If the control is synchronized to the plot, the filter values are automatically changed from 2, 3, and 4 to 3, 4, and 5.
Event Types
The EVENTS list in the Tank Navigator includes standard events and user defined events.
Standard Events
The list will always include three standard events, TIME, CHAN, and SORT. These events are automatically included in every block.
 TIME
TIME CHAN
CHAN SORT
SORTIf a sortID has been previously generated in OpenSorter, you may use it as a filter control. See Adding Sort Code Filters for more information.
These events cannot be plotted. Dragging them to the plot area will generate an error message. The TIME event cannot be used for the x or y axis.
Stores (User Defined)
The remaining events are events that were defined as Stores in the OpenWorkbench acquisition configuration.
Possible event types include:


All Store events can be plotted but only Epoch or Standard events can be used to create filters.