Sorting Statistics
Statistical measures of your sorted data set can help make determinations concerning the optimum number of clusters, the degree of separation between clusters, and how well individual data points have been classified to their respective clusters. The statistics available in OpenSorter are described below.
Available Statistics
Pseudo-F Statistic (PFS)
The PFS is a ratio of variances. It represents a scaled version of the sum of the variance values between
clusters over the sum of the variance values calculated within each cluster. This measure is used to help
determine the optimum number of clusters. The higher the value, the greater the separation between
clusters. [4] The Pseudo-F statistic cannot be computed for single cluster data sets.
Bayesian Information Criterion (BIC) Score
The BIC score is a measure of the log-likelihood of all of the points in the data set being correctly
classified. Each data point is assigned a Gaussian point probability based on the parameters of the
cluster it is assigned to, and a score for each cluster is then computed. The BIC score of the entire data
set is the sum of the BIC scores for all clusters in that data set. Given two clustering models for the
same data set, the model with the higher BIC score is preferred. [1] Since the BIC score is a sum
dependent on the number of included points, it should not be used to compare sets with different numbers
of points.
J1
The J1 is a measure of the variance of the data points within each cluster. It indicates the compactness
of the clusters. The J1 value for the data set is averaged over the J1 values for all the clusters in the
data set. A smaller J1 value indicates better compactness. [7]
J2
This measure indicates the separation between clusters and is averaged over all the clusters in the data
set. A higher J2 value indicates better separation. Since J2 compares separation between clusters, it
cannot be computed for single cluster data sets. [7]
J3 (J2/J1)
As indicated by the equation, the J3 value is a combined measure of the compactness and the separation of
the clusters in a data set. A higher value for the J3 index indicates a well-separated data set with
compact clusters. Since J3 includes a comparison between clusters, it cannot be computed for single cluster
data sets. [7]
Silhouette Index
The Silhouette Index indicates how well each data point has been classified to its assigned cluster as
compared to the other possible clusters in the data set. The measurement is made in terms of the average
Euclidean distance of a given point to its own cluster, compared to the average Euclidean distance to the
points in each of the other clusters in the data set. The Silhouette Index for the data set is the mean of
this measure for all points in the data set and ranges from -1 to 1, where 1 indicates a good
classification, -1 indicates a bad classification and 0 indicates that the classification could go either
way. Since the Silhouette Index compares classification between clusters, it cannot be computed for single
cluster data sets. The Silhouette Index is an excellent tool for comparing sort quality between data sets.
L-Ratio
The L-Ratio is an indication of how separated a given cluster is from other clusters. It is the normalized
sum of the probabilities with which non-cluster points belong to that cluster. Ideally it should have a
value of zero. Since the L-Ratio compares separation between clusters, it cannot be computed for single
cluster data sets. [5]
Isolation Distance
This is a Mahalanobis distance measure of the nearness of a cluster to the non-cluster points. The greater
the value of the isolation distance, the better the separation. The Isolation distance for the largest
cluster is not defined if the number of points in the largest cluster is greater than the sum of the
non-cluster points. [5]
Silhouette/Cluster
The Silhouette/Cluster is an extended version of the Silhouette Index values, where a normalized value is
computed for each cluster based on the silhouette indices for all the points that comprise that cluster. As
with the Silhouette Index, the values can range from -1 to 1, whereby 1 indicates a good classification,
etc.
The Silhouette/Cluster is an excellent tool for comparing sort quality between clusters in individual data sets. [6]
Calculating Statistics
Statistics can be calculated for the current sort or a previously sorted SortID and can be calculated automatically when the algorithm is run or post hoc. Statistics can also be calculated across numerous data sets using the Stats only batch method. See Processing Multiple Data Sets for more information.
Calculating Statistics Automatically
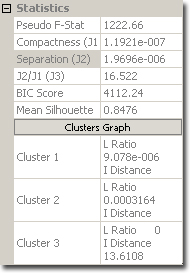
To calculate statistics when the algorithm is run, set the Run Statistics property to True in the Settings panel. The sorting results may take slightly longer to be displayed as the additional task of calculating the statistics is performed before the sorts are updated in the feature space pane, but statistics will be immediately available in the Sort State panel. You can view saved statistics for the current event data by clicking the gray Clusters Graph button on the Sort State panel.
Statistics are displayed for the entire sort and for each cluster. To display saved statistics in a group of graphs, click the gray Clusters Graph button.
Calculating Statistics Post Hoc
When the Run Statistics property is set to False, statistics are not calculated when a sorting algorithm is
run. To calculate statistics for the current data set after running a sorting algorithm, click the
 Calculate Statistics for Current Set button on the Standard
toolbar. The Statistics window (shown below) will be displayed automatically and the statistics will be
available in the Sort State panel. In addition, clicking the Compute Cluster Statistics button located in
the Sort State panel can be used to calculate statistics for the current data set and display the Statistics
window.
Calculate Statistics for Current Set button on the Standard
toolbar. The Statistics window (shown below) will be displayed automatically and the statistics will be
available in the Sort State panel. In addition, clicking the Compute Cluster Statistics button located in
the Sort State panel can be used to calculate statistics for the current data set and display the Statistics
window.
Statistics are displayed for the entire sort and for each cluster. To compute cluster statistics for the current data set, click the Compute Cluster Statistics button.
Note
This can also be used to compute the cluster statistics prior to running a sorting algorithm.
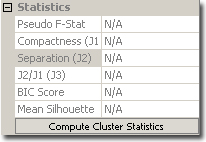
The Statistics dialog is automatically displayed whenever statistics are computed post hoc.
Below is an example of the statistics as they are displayed in the Clusters Graph. The Cluster Pairs tab displays cluster to cluster comparison statistics.
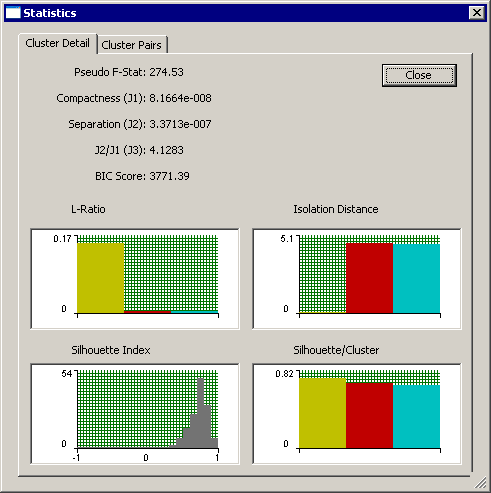
A cluster to cluster comparison allows statistics such as compactness and separation to be computed between each cluster pair. See Cluster to Cluster Comparison for more information.
Viewing Statistics in More Detail
After statistics have been calculated and the sort has been saved to a SortID, you can view statistics in a table in the Statistics Report window. The table provides a convenient way to view or export sort result statistics. It also provides a cluster comparison and allows statistics to be viewed for multiple data sets within a SortID.
To view previously computed statistics in a table format:
-
Select the Display Saved Statistics option from the Sort menu or click the
 Statistics Table button.
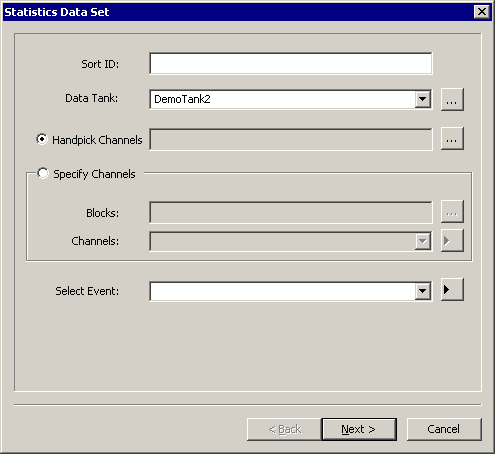
The Statistics Data Set dialog is displayed.
-
Type the desired SortID in the SortID box.
-
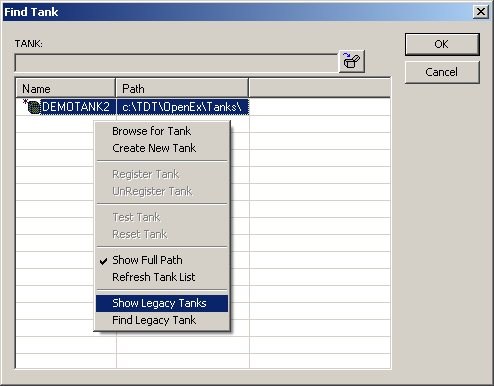
To select the data tank, click the drop-down box or use the ellipsis (...) next to the Data Tank field to browse to the desired data tank.
-
Select a tank from the list or browse for a legacy format or unregistered tank.
-
Click OK.
-
-
Next you must select the sorted data sets of interest.
-
To specify differing channels within each block to be processed (for example, channel 2 of block 3 and channel 4 of block 5), choose the Handpick Channels option.
-
Click the ellipsis (...) next to the Handpick Channels option.
-
In the Pick Data Set dialog, expand the desired blocks by double-clicking the desired blocks and select desired channels using standard Windows keyboard methods (click, Shift + click to select contiguous blocks or Ctrl + click to select non-contiguous blocks).
-
Click Done.
-
-
To specify a fixed group of channels to be processed all within a selected block (for example, channel 2 of blocks 3, 4, and 5), choose the Specify Channels option.
-
Click the Specify Channels option.
-
Click the ellipsis (...) next to the Blocks field. In the Pick Data Set dialog, select the desired blocks using standard Windows keyboard methods.
-
Click Done.
-
In the Channels box, type the desired channel numbers separated by a comma or semicolon or by a dash to select a range. Leaving this field blank will assume all channels are intended to be used.
-
-
To process all channels in all blocks selected, choose either option and select only at the block level. Do not pick or specify any channels.
-
-
In the Events box, leave the field blank to include all spike events or type the four character event code to select a specific event.
-
Click Next.
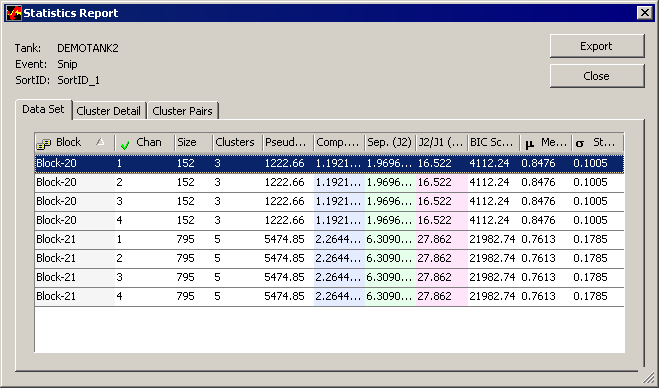
Click the Cluster Details or Cluster Pairs tabs for further statistics or export the statistics to a .csv file using the Export button. See Exporting Statistics for more information.
Cluster to Cluster Comparison
While the general statistics provided by the Clusters Graph are useful, some researchers may require more in depth statistics. The general statistics average the compactness and separation over all clusters which may dilute the accuracy of the statistic. A cluster to cluster comparison allows statistics such as separation (J2) and combined measurement (J3) to be computed between each cluster pair.
Cluster to cluster comparison statistics are displayed in the Cluster Pairs tab of the Statistics Report window.
To access the Cluster Pairs tab:
-
Open the Statistics Report window as described above in Viewing Statistics in More Detail and click the Cluster Pairs tab.
or
-
Click the
Sort Result Statistics button on the Standard
toolbar and click the Cluster Pairs tab.or
-
Click the Clusters Graph button in the Sort State panel and click the Cluster Pairs tab.
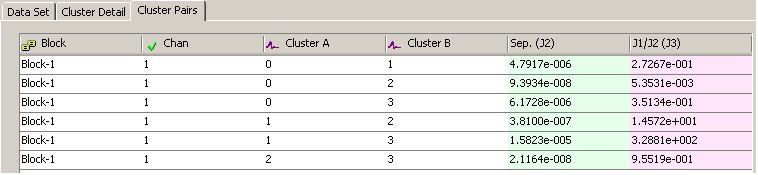
Cluster statistics are displayed in a tabular arrangement where each permutation of cluster comparison is displayed. Statistics for separation (J2) and combined measurement (J3) are provided and color coded for each cluster pair. The cluster pair being compared is identified under the Cluster A and Cluster B columns.
Exporting Statistics
Statistics can be exported directly from OpenSorter. This allows portability of statistics across multiple platforms. Statistics are exported from OpenSorter in *.csv format and can be easily viewed through spreadsheet applications such as Microsoft Excel.
To export saved statistics:
-
Access the saved statistics for the desired SortID(s) as described in Viewing Statistics in More Detail.
-
Click the Export button on the Statistics Report dialog box.
-
Enter the desired filename for the *.csv file and click Save.