Sorting
OpenSorter offers manual, semi-automatic, and fully automatic sorting methods. This section provides detailed information about using each method.
Selecting a Sort Method
OpenSorter offers two general sorting methods: automated, algorithm-based sorting methods that automatically assign sort codes to each spike based on user-defined algorithm parameter settings, and graphical or "manual" selection and assignment of spikes using OpenSorter's mouse-based selection tools. You can use any method or a combination of methods to yield the best possible sort results. Automated sorting results can later be edited and spikes re-assigned using manual sorting methods.
Fully Automated Sorting
No user input is required. The number of clusters, or units, is decided algorithmically and
waveforms are assigned a sort code automatically.
- Bayesian - Sorting based on expectation-maximization analysis of Bayesian probabilities.
Semi-Automated Sorting
User selects a sorting method and specifies key sorting parameters.
- K-Means - User inputs the number of clusters, or units, based on visual observation of the Feature Space and then runs the K-Means algorithm that assigns sort codes automatically.
- Closest Centers - User selects the location of any number of cluster centers in the Feature Space window and then runs the Closest Centers algorithm that assigns sort codes automatically.
Manual Sorting
Manually specify the unit assignment for each waveform.
- Waveform Time/Amplitude Method - Waveforms are manually selected as belonging to a unit by drawing lines across waveforms to create a time amplitude window in a waveform space.
- Cluster Boundary Method - Waveforms are manually selected in the feature space by drawing an arbitrary shape around a visible cluster.
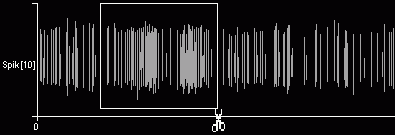
- Time Boundary Method - Waveforms are manually selected in the timeline by drawing a rectangle around a segment of the timeline.
Automated Sort Methods
To select an automated sorting method, select the sorting method on the Select Sort Algorithm drop-down list on the Sort toolbar.
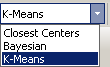
The selected algorithm will appear highlighted in the Settings panel.
The Bayesian Algorithm
The Bayesian algorithm provides fully automated sorting. With this algorithm, OpenSorter evaluates the specified sorting Feature Space of the data set and automatically computes the number of units present in the data and the waveforms that comprise those units. Initially, the entire data set is treated as one parent cluster. This is split to form two child clusters in an iterative process that continues as long as the Bayesian Information Criterion (or BIC score) of the split data set is better as a result of the split and the distortion statistics calculated for the children are not scaled chi-squared distributions. [1, 2]
The K-Means Algorithm
The K-Means algorithm is a semi-automated sorting method. The only input required from the user is the desired number of clusters that the data set is to be divided into. A binary split algorithm uses this number as an input and attempts to find the optimum locations of the cluster centers using an iterative process. Data points are then assigned to those clusters based on either their distances away from the cluster center (smallest value) or their probabilities of being allocated to each of the clusters (largest value). [3]
The Closest Centers Algorithm
The Closest Centers algorithm allows you to specify the location of cluster centers in the feature space before sorting. Data points are assigned to clusters based on the nearest defined center. This distance measure could either be in Mahalanobis or Euclidean distance depending on the user's preference. Probabilities are not valid sort parameters when this algorithm is run.
Configuring Your Algorithm
Configuration settings for all automated sort algorithms are located in the Settings panel. Here users may select from several parameters that are used when the algorithm is run.
Bayesian Setting Parameters
While this algorithm is fully automated, the user may select some parameters in the Settings panel. Default values suitable for most cases are provided.
To modify settings, enter a value or select from available options. If a default (non-number) option is displayed, double-clicking the desired setting box in the list cycles through the setting options one at a time.
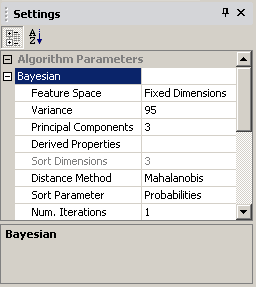
Feature Space: Fixed Dimensions or Fixed Variance
Select whether the number of dimensions for sorting is based on a fixed number of specified dimensions
or on the number of dimensions explaining a specified percentage of the variance in the data.
- FIXED DIMENSIONS: The number of desired principal components plus any specified derived properties (VMax, VMin, MaxSlope, Area) are used to sort the selected data. To use only derived properties, set the principal components field to zero and select the derived properties you wish to use from the derived properties drop-down menu.
- FIXED VARIANCE: Uses a variable number of principal components corresponding to the number of principal component dimensions required to explain the specified percentage variance in the data set being sorted. The same percentage variance could represent a different number of principal components for different data sets. Note that derived properties are not used when Fixed Variance is selected.
Note
Parameters that are not used by the Feature Space setting selected are ignored. For example, when Fixed Dimensions is selected the value set for the Variance parameter is ignored.
Variance: Specify the percentage of variance to be accounted for. Used only when the Feature Space parameter is set to Fixed Variance.
Principal Components: Specify the number of principal components to be used. Used only when the Feature Space parameter is set to Fixed Dimensions.
Derived properties: Select any derived properties to be used as a dimension for sorting. Used only when the Feature Space parameter is set to Fixed Dimensions. Options for Derived Properties are: VMax, VMin, MaxSlope, and Area. To use multiple options separate each with a comma.
Distance Method: Specify Mahalanobis or Euclidean distance to be used when sorting using distances.
Sort Parameter: Probabilities or Distance
- SORTING USING DISTANCES: Data points are assigned to clusters based on distances from the centers of the clusters. Also select the Distance Method (Mahalanobis or Euclidean).
- SORTING USING PROBABILITIES: Data points are assigned to a given cluster based on the probability of belonging to that cluster. Bayesian probabilities are computed for the data points and are used to make the assignment decision.
Num. Iterations: The Bayesian algorithm is repeated for the specified number of iterations, and the sort with the best score is automatically selected. After the first iteration, the center of the initial parent cluster is assigned at random, rather than along the axis of maximum variance of the data set. Repeated iterations may produce better results than a single iteration in some cases.
K-Means Setting Parameters
In addition to the number of clusters to partition the data set into, the user may select the following parameters in the Settings panel.
To modify settings, enter a value or select from available options. If a default (non-number) option is displayed, double-clicking the desired setting box in the list cycles through the setting options one at a time.
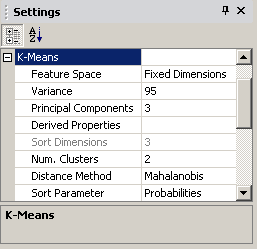
Feature Space: Fixed Dimensions or Fixed Variance
Select whether the number of dimensions for sorting is based on a fixed number of specified dimensions
or on the number of dimensions explaining a specified percentage of the variance in the data.
- FIXED DIMENSIONS: The specified number of principal components plus any specified derived properties (VMax, VMin, MaxSlope, Area) are used to sort the selected data. To use only derived properties, set the principal components field to zero and select the derived properties you wish to use from the derived properties drop-down menu.
- FIXED VARIANCE: Uses a variable number of principal components corresponding to the number of principal component dimensions required to explain the specified percentage variance in the data set being sorted. The same percentage variance could represent a different number of principal components for different data sets. Note that derived properties are not used when Fixed Variance is selected.
Note
After selecting Fixed Dimensions or Fixed Variance, the user must ensure that the corresponding parameters, such as variance or principal components, are set appropriately.
Variance: Specify the percentage of variance to be accounted for. Used only when the Feature Space parameter is set to Fixed Variance.
Principal Components: Specify the number of principal components to be used. Used only when the Feature Space parameter is set to Fixed Dimensions.
Derived properties: Select any derived properties to be used as a dimension for sorting. Used only when the Feature Space parameter is set to Fixed Dimensions. Options for Derived Properties are: VMax, VMin, MaxSlope, and Area. To use multiple options separate each with a comma.
Num Clusters: Specify the desired number of clusters (based on visual inspection of the data).
Distance Method: Specify Mahalanobis or Euclidean distance to be used when sorting using distances.
Sort Parameter: Probabilities or Distance
- SORTING USING DISTANCES: Data points are assigned to clusters based on distances from the centers of the clusters. Also specify the Distance Method (Mahalanobis or Euclidean) when using this option.
- SORTING USING PROBABILITIES: Data points are assigned to a given cluster based on the probability of belonging to that cluster. Bayesian probabilities are computed for the data points and are used to make the assignment decision.
Closest Centers Setting Parameters
Before setting parameters may be configured for the Closest Centers algorithm, the cluster centers must be defined.
Defining Centers
Before marking centers use the  Rotate 3D Display tool to
position the view of the feature space display at the best possible angle for marking centers. The
display parameter settings can also be used to configure the 3D display. See
Exploring Data in the Feature Space Pane for more
information.
Rotate 3D Display tool to
position the view of the feature space display at the best possible angle for marking centers. The
display parameter settings can also be used to configure the 3D display. See
Exploring Data in the Feature Space Pane for more
information.
Centers are specified by clicking the  Mark Centers for Sort
button on the Mouse toolbar then clicking the desired center in the feature space pane. The illustration
below shows the feature space pane with centers marked.
Mark Centers for Sort
button on the Mouse toolbar then clicking the desired center in the feature space pane. The illustration
below shows the feature space pane with centers marked.
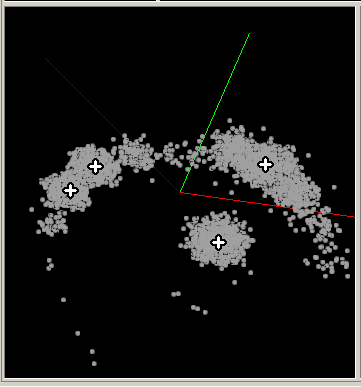
For the purposes of determining the location of marked centers, the feature space is flattened to the two dimensions in view.
If a center is placed incorrectly, all centers must be cleared and placed again. You can clear the centers
by  repainting the display.
After the centers are defined, the user may select the following parameters in the Settings panel.
To modify settings, enter a value or select from available options. If a default (non-number) option is displayed, double-clicking the desired setting box in the list cycles through the setting options one at a time.
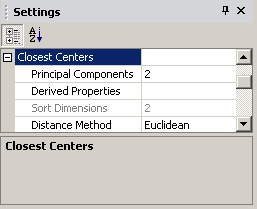
Principal Components: Specify the number of principal components to be used.
Note
The combined total of principal components and derived properties must equal 3.
Derived Properties: Select derived properties to be used as a dimension for sorting. Options for Derived Properties are: VMax, VMin, MaxSlope, and Area. To use multiple options separate each with a comma.
Distance Method: Mahalanobis or Euclidean, data points are assigned to clusters based on distances from the centers of the clusters.
Outliers Setting Parameters
OpenSorter supports eliminating outliers at the data set level and/or at the cluster level and allows users to specify the number of standard deviations (max = 10) beyond the mean to set as outlier threshold. See Eliminating Outliers for more information.
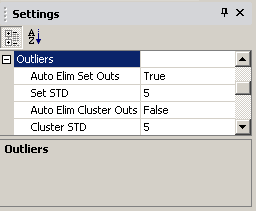
Auto Elim Set Outs: Set to True to eliminate data set level outliers. If set to True, the set level outliers will be calculated and eliminated from the data set before the automated sorting algorithm is run. Set level outliers can also be calculated after the sort is complete using buttons on the Standard toolbar and edited or refined using manual sorting tools.
Set STD: Enter the number of standard deviations to be used in identifying data set level outliers.
Auto Elim Cluster Outs: Set to True to eliminate cluster level outliers. If set to True, the cluster level outliers will be calculated after the automated sorting algorithm has been run. Cluster-level outliers can be calculated after the sort is complete using buttons on the Standard toolbar and edited or refined using manual sorting tools.
Cluster STD: Enter the number of standard deviations to be used in identifying cluster level outliers.
Run Statistics Parameter
Set to True to automatically calculate and display sorting statistics with the selected algorithm. See Examining Sorting Statistics for more information.
Display Parameters
For a detailed description of the display parameters settings see Display Parameters.
Running the Sorting Algorithm
When the desired parameters are set and the sorting method is selected, click the
 Run Selected Algorithm button on the toolbar or press F5 on
the keyboard.
Run Selected Algorithm button on the toolbar or press F5 on
the keyboard.
Important
The sorting algorithm is run based on values set in the Settings panel. Modifications to the feature space display have no effect on sorting. Further, any sorting (manual or automatic) completed prior to running an automated sorting algorithm is discarded when the sorting algorithm is run.
Saving the Sort Results
After running the desired sort method you will need to save the results to a SortID.
To save the sort results to a SortID:
- Click the
 SaveSortID button on the Standard toolbar.
Using Manual Sort Methods
Manual sorting provides the greatest degree of flexibility and control at the expense of more time and effort by the user. Manual sorting can be used as the primary sorting method or to edit and re-assign units after automated sorting.
All manual methods use the same tool, but in different sub-windows. They can be used independently or in combination.
Before beginning manual sorting, various settings and tools can be used to display the data set in a favorable way. In the feature space the display can be manipulated to better display cluster separation. See Exploring Data in the Feature Space Pane for more information. In the timeline pane the display can be scaled to better view individual waveforms. See Navigating the TimeLine for more information.
To assign units to clusters using any manual method:
-
Click the
 Manual Pick Cluster button on the Mouse
toolbar (or hold down Ctrl + Shift and click the left mouse button).
Manual Pick Cluster button on the Mouse
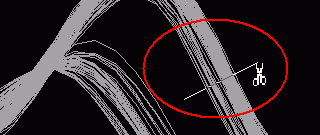
toolbar (or hold down Ctrl + Shift and click the left mouse button).Waveform Time/Amplitude Method - use the mouse to draw a time-voltage line across a bundle of waveforms in the waveform space pane or units display.
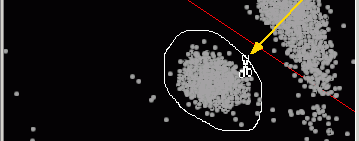
Cluster Boundary Method - use the mouse to draw an arbitrary shape around a visible cluster in the feature space pane.
Time Boundary Method - use the mouse to draw a rectangle around a segment of the timeline in the timeline pane. Be sure the rectangle is large enough to include waveforms in their entirety. Only waveforms that fall completely within the boundary will be selected.
-
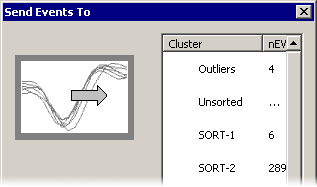
When the mouse button is released, the Send Events To dialog will open.
-
Select an existing or empty cluster from the list to send the selected waveforms to the corresponding cluster, or sort code.
Note
You may use this method to eliminate outliers by setting the desired waveforms to the Outliers sort code.
-
Repeat this process as needed.
-
To save results, click the
SaveSortID button on the
Standard toolbar.
To clear all sorts and begin again:
- Click the
 Clear All Sorts button on the Standard toolbar.
Eliminating Outliers
OpenSorter supports eliminating outliers, either manually or automatically. Manual elimination is performed using mouse-based sorting and editing tools. Automated algorithms are also available that automatically calculate outliers at the data set and/or cluster levels. The function of the automated outlier methods is controlled by parameter settings in the Settings panel. Here, outliers are defined as points that are further than a specified number of standard deviations (max = 10) beyond the mean of the data under consideration.
Data-Set-Level Outliers
Spike shapes that are drastically different from the majority of the spike shapes in the data set tend to lie
away from the center of the corresponding feature space representation.
These spikes can be excluded from being sorted by assigning them as outliers. To compute set-level outliers, the Mahalanobis distances of all data points are computed from the center of the entire data set. The mean and the standard deviation of these distances are then used to set a boundary around the data set, n standard deviations away from the mean. Any point lying beyond this boundary is classified as an outlier.
Data set level outliers can be computed either before or after automated sorting algorithms are run. The order
in which these operations are run will influence the results of automated sorting algorithms. This is because
set-level outliers are not considered as valid input by the automated algorithms. Select True for Elim Set
Outliers in the Settings panel to eliminate outliers in the data set before automated algorithms are run. To
consider all data points in the automated sorting algorithms, set this field to False. Set-level outliers can
later be discarded by clicking the  Calculate Set Level
Outliers button in the toolbar.
Calculate Set Level
Outliers button in the toolbar.
Cluster-Level Outliers
After the data has been sorted into different clusters, outliers between clusters can also be eliminated. The
logic used is similar to that at the set-level, but here, the Mahalanobis distances of all of the points in
each cluster from their respective cluster center are computed. A boundary is then set around each cluster as
n standard deviations of those cluster point distances from the cluster mean. Cluster points that lie beyond
their cluster boundary are eliminated at this stage as cluster-level outliers. Since, by definition,
cluster-level outliers are not calculated until sorting is complete, cluster-level outliers do not influence
output of the automated sorting algorithms.
To eliminate outliers automatically when the sort is implemented:
-
If you wish to eliminate data set level outliers, set Auto Elim Set Outs to True under Outliers in the Settings panel and enter the number of standard deviations to be used in identifying outliers in the Set STD value box.
-
If you wish to eliminate cluster level outliers, set Auto Elim Cluster Outs to True under Outliers in the Settings panel and enter the number of standard deviations to be used in identifying cluster level outliers in the Cluster STD value box.
-
After all algorithm settings are also complete, click the
Run
Selected Algorithm button on the Standard toolbar.
To eliminate data-set-level outliers in a separate step:
-
In the Set STD value box under Outliers in the Settings panel, enter the number of standard deviations to be used in identifying outliers.
-
Click the
Calculate Set Level Outliers button on the
Standard toolbar.Important
If the sort is performed again using the Run Selected Algorithm button, outliers will be recalculated based on settings (True or False) in the Settings panel.
To eliminate cluster level outliers in a separate step:
-
In the Cluster STD value box under Outliers in the Settings panel, enter the number of standard deviations to be used in identifying cluster level outliers.
-
Click the
 Calculate Cluster Level Outliers button on
the Standard toolbar.
Calculate Cluster Level Outliers button on
the Standard toolbar.
To eliminate outliers manually:
-
Click the
Manual Pick Clusters button on the Mouse
toolbar. This transforms the mouse into a cutting tool, represented by scissors. This tool can be used in
any pane of the tabbed window. -
In the waveform space pane or units display, use the manual picking tool to drag/draw a time/magnitude line across the desired waveforms.
or
In the feature space, click and drag to draw a curve around the desired data points.
or
In the timeline pane, click and drag a boundary around the desired waveforms.
-
When the mouse button is released, the Send Events To dialog opens.
-
Select the Outliers cluster.
The selected waveforms are added to the outliers cluster, that is, they are assigned a reserved sort code of "31" to identify them as outliers.
Important
If the sort is performed again using the Run Selected Algorithm button, outliers will be recalculated based on settings (True or False) in the Settings panel.