Using Epochs with OpenScope
OpenScope uses epochs to organize and display data. Epochs are stored events that are associated with a block's timeline.
Epochs serve two main functions:
-
To display data in groups so that each group is associated with a particular event.
-
To change or refresh the plot in response to changes in an event.
Plot settings related to epoch events can be found in the Refresh Control and Behavior parameter groups in a plot's property settings dialog box.
Refresh Control: All plots have refresh control settings that allow the user to define a refresh epoch. When a refresh epoch event is defined the plot will be refreshed based on the epoch value according to the settings in the Refresh Control parameter group. To learn more about the settings see Refresh Control Parameter settings.
Behavior: Histogram and raster plots use a time reference epoch event to sort and display data and to determine what data is plotted according to settings in the Behavior parameter group. To learn more about the settings see Histogram Behavior Parameter settings or Raster Behavior Parameter settings.
The Refresh Control and Behavior settings can be used independently or in combination. Because different epoch events can be selected for the Refresh Control and Behavior, the data can be refreshed by a value that is independent of the time reference epoch. This behavior allows users to develop several graphs each associated with a unique event. Data can then be compared across event parameters.
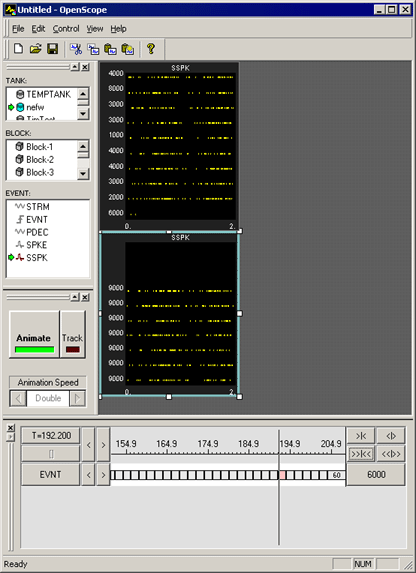 |
| Raster Plots with Different Behavior Settings |
The OpenScope plots show two raster plots that differ in their behavior. The top plot displays all the data and the bottom plot displays only data in events that have the value 9000. The difference between the two plots is how the behavior settings use epoch events. In the bottom plot the behavior of the plot is controlled by setting limits on the range of epoch events that are displayed.
Using Refresh Control Settings
Refresh Control settings determine when displayed data is removed from the display. Epoch events can be used to control what set of data is shown on screen. For example, a pile plot can be set to remove old data and show only new data each time the epoch event changes. This would allow users to examine spike patterns that are associated with an event, such as a single stimulus event.
To view data for a single event value at a time:
-
In the plot's Refresh Control parameter group settings, in the Refresh Epoch Name box, select the desired epoch event.
-
Enter the high and low epoch values for the range over which the plot should refresh in the Strobe Epoch Low Range and Strobe Epoch High Range boxes.
-
Select the Refresh on Change check box. If Refresh on Change is not selected old data is removed and new data is displayed on each epoch within the boundary conditions set by Strobe Epoch Low Range and Strobe Epoch High Range.
In many cases the user might want to refresh on a particular event. For example, if an experiment calls for ten presentations of the same stimulus; after the last stimulus, the stimulus can be updated. If the stimulus number is included as an epoch then the plot can be refreshed when the stimulus number reaches a certain value.
Using Behavior Settings in Raster and Histogram Plots
Behavior settings determine how data is displayed, and what data is displayed, in a plot. When an epoch event is defined for a Raster or Histogram plot only the data associated with the epoch's scalar values will be displayed. For example, if a user wants to display only signal responses that occur when a particular stimulus is presented, such as a 9 kHz tone, the plot behavior can be set so that a new raster pattern is displayed only when this event occurs.