Data Browsing
About the Data View Area
The Data View area allows table or graphic visualization of tank data from a selected row. To switch between table and scroll plot views, select or clear the Data View Table option on the View menu.
Scroll Plot View
The scroll plot displays waveform or scalar data from an event as well as the
associated scalar information from epochs. Epochs are displayed above the event data.
In the scroll plot below, an epoch (Freq) associated with the time line is shown above
the event (Snip) line.
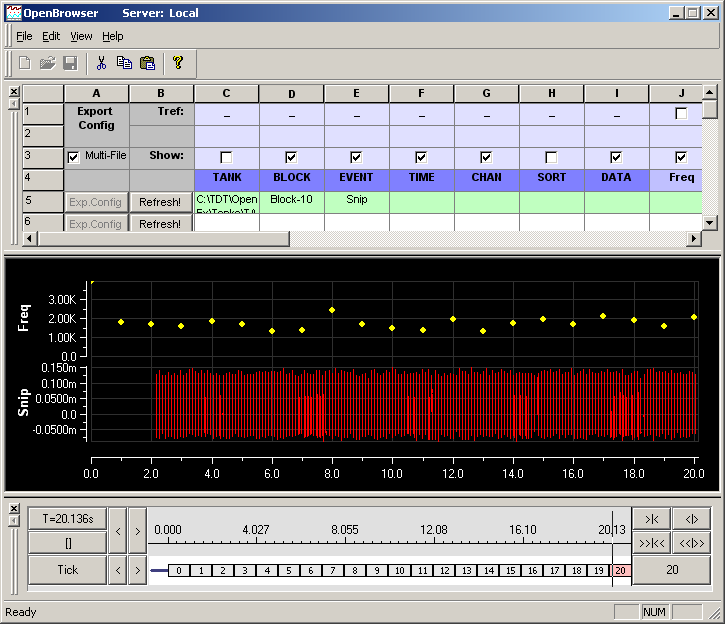
To modify which epochs are displayed, choose the Show check box for the event column in the Data Selection Table window.
To move about the Scroll plot, select the marker in the Time Line window and move it to the time stamp or event of interest. The time range can be expanded or contracted to give additional detail about the waveforms using the Time Line window.
Table View
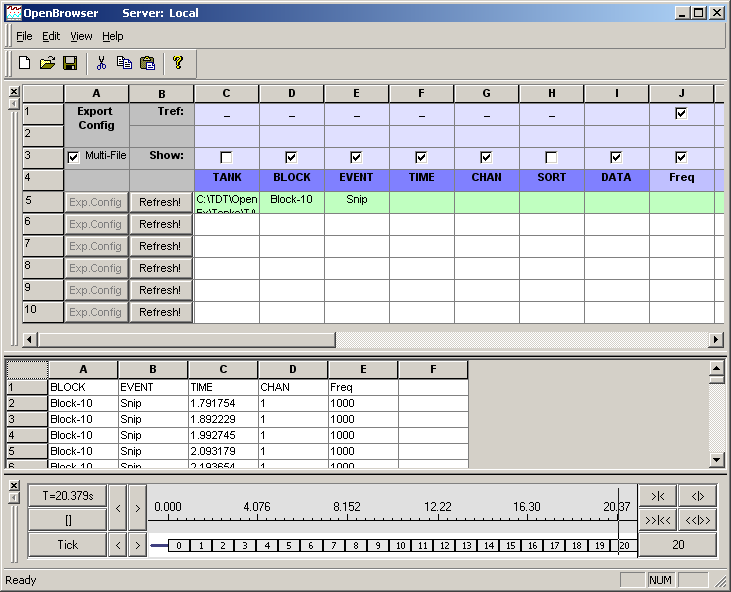
In table view the variables selected in the Show row of the Data Selection Table
window are displayed. The time stamp associated with the event and any associated
epochs are displayed. If Tref is selected in the Data Selection Table window the time
stamps displayed will be relative to the start of the epoch.
To determine which variables such as block number, tank name, time stamp, and epochs are displayed, choose the corresponding Show check boxes in the Data Selection Table window.
All data can be copied and pasted from the table to a Microsoft Word document or Excel spreadsheet. To copy the data, select the range of cells, right-click the selected cells, and click the Copy command on the shortcut menu. To paste the data into another application, go to that application and press CTRL+V.
In the example below the event, time stamp (in this case the spike times), channel number, and epochs are displayed.
Using the Time Line Window
The Time Line window provides a timeline and vertical line indicator that moves as data is animated in the Scroll Plot view of the Data View area. The Time Line window can also be used to move to a particular time or event in the Data View area. Epoch events that are included in the selected data area are also added to the window. The Time Line window gives a precise description of when data was collected.

Timeline by Time Stamps



Scale Controls


Timeline by Events



