Introduction to Python
Using the tdt Package
This primer walks through installing the tdt Python package, shows how to convert existing MATLAB code to Python, and highlights some of the differences when working in Python.
Installation
-
Make sure that you have Anaconda installed.
-
Open an Anaconda Prompt and type:
pip install tdt -
Done!
Converting Existing MATLAB Code to Python
The tdt Python library for reading TDT data is one-to-one compatible with the MATLAB library, however the function names and parameter names are different.
Extracting Block Data
TDTbin2mat extracts block data into a MATLAB structure.
data = TDTbin2mat(BLOCK_PATH);
The Python equivalent is read_block.
from tdt import read_block
data = read_block(BLOCK_PATH)
TDTbin2mat and read_block share parameters, but the parameters have different names.
Parameter Name Translation Table
Epoc Filtering
TDTfilter filters events around epoc events in MATLAB:
data = TDTbin2mat(BLOCK_PATH);
data = TDTfilter(data, 'Tick', 'TIME', [-0.3, 0.8], 'VALUES', [5, 10, 15]);
The Python equivalent is epoc_filter:
from tdt import read_block, epoc_filter
data = read_block(BLOCK_PATH)
data = epoc_filter(data, 'Tick', t=[-0.3, 0.8], values=[5, 10, 15])
TDTbin2mat and read_block share parameters, but the parameters have different names.
Parameter Name Translation Table
Extracting SEV Data
SEV2mat extracts SEV files from a given directory into a MATLAB structure. These files are created on the RS4 Data Streamer or by enabling the Discrete Files option in the Synapse Stream Data Storage gizmo. Each SEV file contains a header and the raw binary data from a single channel.
data = SEV2mat(BLOCK_PATH);
The Python equivalent is read_sev.
from tdt import read_sev
data = read_sev(BLOCK_PATH)
SEV2mat and read_sev share parameters, but the parameters have different names.
Parameter Name Translation Table
Walkthrough
Let's look at some basic concepts for working with Python and the tdt library.
***Python Tips!**
Use print in Python in place of disp in MATLAB.
% is a special command used mainly in Python notebooks
# creates a single-line comment in Python
Use ''' to make a multi-line comment
First we'll import the critical libraries.
# this is a single line comment

''' this is a comment
spanning multiple lines'''

# special call that tells notebook to show matlplotlib figures inline
%matplotlib inline

import matplotlib.pyplot as plt  # standard Python plotting library
import numpy as np  # fundamental package for scientific computing, handles arrays and maths

# import the tdt library
import tdt
***Python Tip!**
Use the __doc__ function to get help on a function.
print(tdt.read_block.__doc__)
TDT tank data extraction.

    data = read_block(block_path), where block_path is a string, retrieves
    all data from specified block directory in struct format. This reads
    the binary tank data and requires no Windows-based software.

    data.epocs      contains all epoc store data (onsets, offsets, values)
    data.snips      contains all snippet store data (timestamps, channels,
                    and raw data)
    data.streams    contains all continuous data (sampling rate and raw
                    data)
    data.scalars    contains all scalar data (samples and timestamps)
    data.info       contains additional information about the block

    optional keyword arguments:
        t1          scalar, retrieve data starting at t1 (default = 0 for
                        beginning of recording)
        t2          scalar, retrieve data ending at t2 (default = 0 for end
                        of recording)
        sortname    string, specify sort ID to use when extracting snippets
                        (default = 'TankSort')
        evtype      array of strings, specifies what type of data stores to
                        retrieve from the tank. Can contain 'all' (default),
                        'epocs', 'snips', 'streams', or 'scalars'.
                      example:
                          data = read_block(block_path, evtype=['epocs','snips'])
                              > returns only epocs and snips
        ranges      array of valid time range column vectors.
                      example:
                          tr = np.array([[1,3],[2,4]])
                          data = read_block(block_path, ranges=tr)
                              > returns only data on t=[1,2) and [3,4)
        nodata      boolean, only return timestamps, channels, and sort
                        codes for snippets, no waveform data (default = false).
                        Useful speed-up if not looking for waveforms
        store       string, specify a single store to extract
                    list of strings, specify multiple stores to extract
        channel     integer, choose a single channel to extract from
                        stream or snippet events. Default is 0, to extract
                        all channels.
        bitwise     string, specify an epoc store or scalar store that
                        contains individual bits packed into a 32-bit
                        integer. Onsets/offsets from individual bits will
                        be extracted.
        headers     var, set to 1 to return only the headers for this
                        block, so that you can make repeated calls to read
                        data without having to parse the TSQ file every
                        time, for faster consecutive reads. Once created,
                        pass in the headers using this parameter.
                      example:
                        heads = read_block(block_path, headers=1)
                        data = read_block(block_path, headers=heads, evtype=['snips'])
                        data = read_block(block_path, headers=heads, evtype=['streams'])
        combine     list, specify one or more data stores that were saved
                        by the Strobed Data Storage gizmo in Synapse (or an
                        Async_Stream_store macro in OpenEx). By default,
                        the data is stored in small chunks while the strobe
                        is high. This setting allows you to combine these
                        small chunks back into the full waveforms that were
                        recorded while the strobe was enabled.
                      example:
                        data = read_block(block_path, combine=['StS1'])
        export      string, choose a data exporting format.
                        csv:        data export to comma-separated value files
                                    streams: one file per store, one channel per column
                                    epocs: one column onsets, one column offsets
                        binary:     streaming data is exported as raw binary files
                                    one file per channel per store
                        interlaced: streaming data exported as raw binary files
                                    one file per store, data is interlaced
        scale       float, scale factor for exported streaming data. Default = 1.
        dtype       string, data type for exported binary data files
                        None: Uses the format the data was stored in (default)
                        'i16': Converts all data to 16-bit integer format
                        'f32': Converts all data to 32-bit integer format
        outdir      string, output directory for exported files. Defaults to current
                        block folder if not specified
        prefix    string, prefix for output file name. Defaults to None
print(tdt.epoc_filter.__doc__)
TDT tank data filter. Extract data around epoc events.
    data = epoc_filter(data, epoc) where data is the output of read_block,
    epoc is the name of the epoc to filter on, and parameter value pairs
    define the filtering conditions.

    If no parameters are specified, then the time range of the epoc event
    is used as a time filter.

    Also creates data.filter, a string that describes the filter applied.
    Optional keyword arguments:
        values      specify array of allowed values
                      ex: tempdata = epoc_filter(data, 'Freq', values=[9000, 10000])
                        > retrieves data when Freq = 9000 or Freq = 10000
        modifiers   specify array of allowed modifier values.  For example,
                      only allow time ranges when allowed modifier occurred
                      sometime during that event, e.g. a correct animal response.
                      ex: tempdata = epoc_filter(data, 'Resp', modifiers=[1])
                        > retrieves data when Resp = 1 sometime during the allowed
                        time range.
        t           specify onset/offset pairs relative to epoc onsets. If the
                      offset is not provided, the epoc offset is used.
                      ex: tempdata = epoc_filter(data, 'Freq', t=[-0.1, 0.5])
                        > retrieves data from 0.1 seconds before Freq onset to 0.4
                          seconds after Freq onset. Negative time ranges are discarded.
        tref        use the epoc event onset as a time reference. All timestamps for
                      epoc, snippet, and scalar events are then relative to epoc onsets.
                      ex: tempdata = epoc_filter(data, 'Freq', tref=True)
                        > sets snippet timestamps relative to Freq onset
        keepdata    keep the original stream data array and add a field called
                      'filtered' that holds the data from each valid time range.
                      Defaults to True.

    IMPORTANT! Use a time filter (t argument) only after all value filters have been set.
print(tdt.read_sev.__doc__)
TDT sev file data extraction.

    data = read_sev(sev_dir), where sev_dir is a string, retrieves
    all sev data from specified directory in struct format. sev_dir can
    also be a single file. SEV files are generated by an RS4 Data Streamer,
    or by enabling the Discrete Files option in the Synapse Stream Data
    Storage gizmo, or by setting the Unique Channel Files option in
    Stream_Store_MC or Stream_Store_MC2 macro to Yes in OpenEx.

    If exporting is enabled, this function returns None.

    data    contains all continuous data (sampling rate and raw data)

    optional keyword arguments:
        t1          scalar, retrieve data starting at t1 (default = 0 for
                        beginning of recording)
        t2          scalar, retrieve data ending at t2 (default = 0 for end
                        of recording)
        channel     integer, returns the sev data from specified channel
                        only (default = 0 for all channels)
        ranges      array of valid time range column vectors
        just_names  boolean, retrieve only the valid event names
        event_name  string, specific event name to retrieve data from
        verbose     boolean, set to false to disable console output
        fs          float, sampling rate override. Useful for lower
                        sampling rates that aren't correctly written into
                        the SEV header.
        export      string, choose a data exporting format.
                        csv:        data export to comma-separated value files
                                    streams: one file per store, one channel per column
                                    epocs: one column onsets, one column offsets
                        binary:     streaming data is exported as raw binary files
                                    one file per channel per store
                        interlaced: streaming data exported as raw binary files
                                    one file per store, data is interlaced
        scale       float, scale factor for exported streaming data. Default = 1.
        dtype       string, data type for exported binary data files
                        None: Uses the format the data was stored in (default)
                        'i16': Converts all data to 16-bit integer format
                        'f32': Converts all data to 32-bit integer format
        outdir      string, output directory for exported files. Defaults to current
                        block folder if not specified
        prefix    string, prefix for output file name. Defaults to None
Download demo data from the TDT website
tdt.download_demo_data()
demo data ready
This example uses our example data sets. To import your own data, replace BLOCK_PATH with the full path to your own data block.
In Synapse, you can find the block path in the database. Go to Menu > History. Find your block, then Right-Click > Copy path to clipboard.
BLOCK_PATH = 'data/Algernon-180308-130351'
data = tdt.read_block(BLOCK_PATH)
read from t=0s to t=61.23s
print(data)
epocs   [struct]
snips   [struct]
streams [struct]
scalars [struct]
info    [struct]
time_ranges:    array([[ 0.],
       [inf]])
read_block returns a structured object. It is a Python dictionary but also allows you to use the dot syntax like in MATLAB, so you can access fields within the structure with either method. These two ways of looking at the block info field are equivalent:
data.info
tankpath:   'data'
blockname:  'Algernon-180308-130351'
start_date: datetime.datetime(2018, 3, 8, 13, 3, 53, 999999)
utc_start_time: '13:03:53'
stop_date:  datetime.datetime(2018, 3, 8, 13, 4, 55, 233578)
utc_stop_time:  '13:04:55'
duration:   datetime.timedelta(seconds=61, microseconds=233579)
stream_channel: 0
snip_channel:   0
data['info']
tankpath:   'data'
blockname:  'Algernon-180308-130351'
start_date: datetime.datetime(2018, 3, 8, 13, 3, 53, 999999)
utc_start_time: '13:03:53'
stop_date:  datetime.datetime(2018, 3, 8, 13, 4, 55, 233578)
utc_stop_time:  '13:04:55'
duration:   datetime.timedelta(seconds=61, microseconds=233579)
stream_channel: 0
snip_channel:   0
These three methods to access the 'Wav1' store sampling rate are equivalent:
data.streams.Wav1.fs # dot syntax
24414.0625
data['streams']['Wav1']['fs'] # dict keys only
24414.0625
data['streams'].Wav1['fs'] # mix of dot syntax and dict keys
24414.0625
***Python Tip!**
Spaces are important in python. Commands like for, if, elif, while, and others require indents to track their nests
for foo in foo_list:
    something
    if foo == check:
        conditional_something
    elif:
        still_in_for_loop
    else:
        still_in_for_loop

out_of_loop
Accessing a field with the string dictionary key method is useful when using a variable name, such as this example which loops through all the stream store names and prints their sampling rates.
print('Sampling rates in', data.info.blockname)
for store in data.streams.keys():
    print(store, '{:.4f} Hz'.format(data.streams[store].fs))
Sampling rates in Algernon-180308-130351
LFP1 3051.7578 Hz
pNe1 498.2462 Hz
Wav1 24414.0625 Hz
Explore Stream events
Let's look at the contents of the stream event structures.
print('all stream stores')
print(data.streams)
all stream stores
LFP1    [struct]
pNe1    [struct]
Wav1    [struct]
print(data.streams.Wav1)
name:   'Wav1'
code:   829841751
size:   2058
type:   33025
type_str:   'streams'
ucf:    False
fs: 24414.0625
dform:  0
start_time: 0.0
data:   array([[ 1.0028159e-03,  1.0012799e-03,  9.9590386e-04, ...,
        -1.5983999e-03, -1.5984639e-03, -1.5852799e-03],
       [ 5.5667193e-04,  5.6723197e-04,  5.6083198e-04, ...,
        -1.4531199e-03, -1.4584319e-03, -1.4480639e-03],
       [-4.6534397e-04, -4.5804796e-04, -4.6521597e-04, ...,
        -1.2184319e-03, -1.2098559e-03, -1.2177919e-03],
       ...,
       [ 2.9247998e-05,  2.3295999e-05,  3.2191998e-05, ...,
        -2.2208637e-03, -2.2241918e-03, -2.2300798e-03],
       [ 7.2191993e-04,  7.1571197e-04,  7.2358397e-04, ...,
        -2.1401597e-03, -2.1399679e-03, -2.1494399e-03],
       [ 2.3078399e-04,  2.3590398e-04,  2.4435198e-04, ...,
        -1.3180159e-03, -1.3103359e-03, -1.3012479e-03]], dtype=float32)
The actual data is store in numpy arrays. For a multi-channel stream store, each row is a channel. Python uses 0-based indexing, so we have to subtract 1 from our channel number when accessing the array
print('channel 1:', data.streams.Wav1.data[0,:])
channel 1: [ 0.00100282  0.00100128  0.0009959  ... -0.0015984  -0.00159846
 -0.00158528]
num_samples = len(data.streams.Wav1.data[0])
print('number of samples:', num_samples)
number of samples: 1490944
Create time vector for plotting by dividing the number of samples in the array by the sampling rate
Wav1_time = np.linspace(1, num_samples, num_samples) / data.streams.Wav1.fs
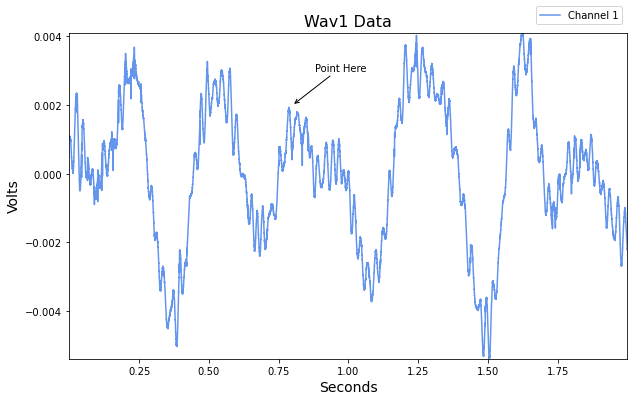
Plot the first 2 seconds from a single channel
t = int(2 * data.streams.Wav1.fs) # int rounds it to the nearest integer

# declare the figure size
fig1 = plt.subplots(figsize=(10, 6))

channel = 1

# plot the line using slices
plt.plot(Wav1_time[0:t], data.streams.Wav1.data[channel-1,0:t], color='cornflowerblue')

# Some matplotlib stuff
# add an annotation mark to the figure
plt.annotate('Point Here',
             xy=(0.8,0.002),
             xytext=(.88,.003),
             arrowprops=dict(arrowstyle='->', color='k')
            )

# create title, axis labels, and legend
plt.title('Wav1 Data', fontsize=16)
plt.xlabel('Seconds', fontsize=14)
plt.ylabel('Volts', fontsize=14)
plt.legend(('Channel {}'.format(channel),),
           loc='lower right',
           bbox_to_anchor=(1.0,1.01)
          )
plt.autoscale(tight=True)
plt.show()
***Python Tip!**
Array slices in Python have some notable differences. 1. Zero-based indexing 2. Omit 'end' and just use a negative index to index starting from the end of the array 3. Omit the starting index if you want to include the first element
MATLAB array slices
arr = 1:10;          % arr = [1 2 3 4 5 6 7 8 9 10]
b = arr(3:5);        % b = [3 4 5]
c = arr(1:end-2);    % c = [1 2 3 4 5 6 7 8]
d = arr(end-1:end);  % d = [9 10]
Python equivalent
arr = np.arange(1,11)  # arr = [1 2 3 4 5 6 7 8 9 10]
b = arr[2:5]           # b = [3 4 5]
c = arr[:-2]           # c = [1 2 3 4 5 6 7 8]
d = arr[-2:]           # d = [9 10]
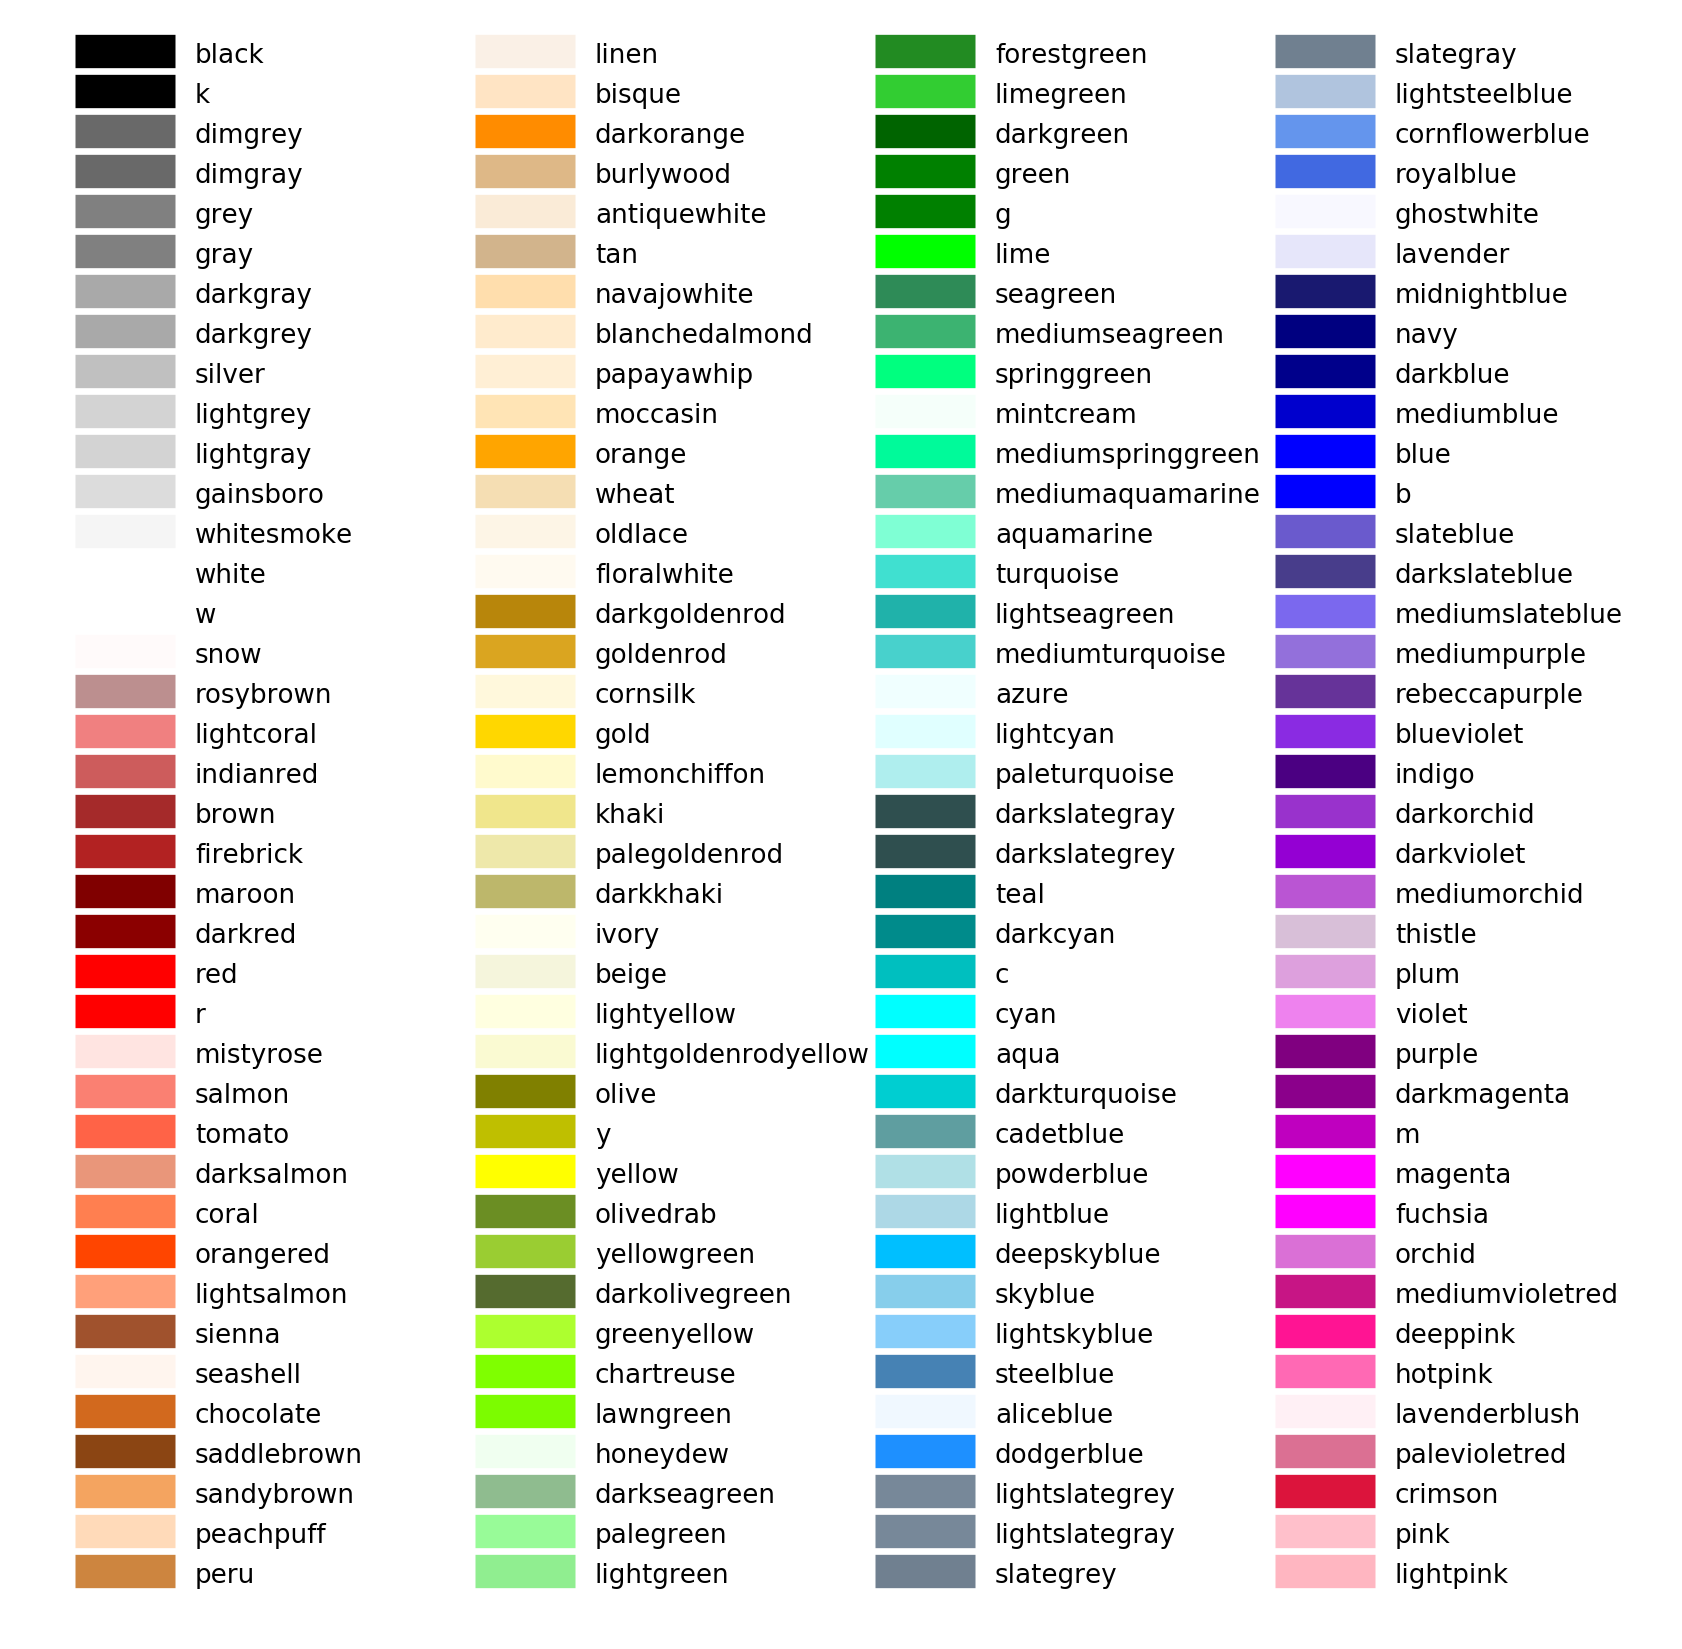
For reference, here are some matplotlib colors originally from this stackoverflow answer
Explore Epoc Events
Let's look at the contents of the epoc event structures.
print('all epoc events')
print(data.epocs)
all epoc events
PC0_    [struct]
Pu1e    [struct]
print(data.epocs.Pu1e)
name:   'Pu1e'
onset:  array([1.22880000e-04, 3.50011392e+00, 7.00010496e+00, 1.05000960e+01,
       1.40000870e+01, 1.75000781e+01, 2.10000691e+01, 2.45000602e+01,
       2.80000512e+01, 3.15000422e+01, 3.50000333e+01, 3.85000243e+01,
       4.20000154e+01, 4.55000064e+01, 4.89999974e+01, 5.24999885e+01,
       5.59999795e+01, 5.94999706e+01])
offset: array([ 0.30011392,  3.80010496,  7.300096  , 10.80008704, 14.30007808,
       17.80006912, 21.30006016, 24.8000512 , 28.30004224, 31.80003328,
       35.30002432, 38.80001536, 42.3000064 , 45.79999744, 49.29998848,
       52.79997952, 56.29997056, 59.7999616 ])
type:   'onset'
type_str:   'epocs'
data:   array([ 1.,  2.,  3.,  4.,  5.,  6.,  7.,  8.,  9., 10., 11., 12., 13.,
       14., 15., 16., 17., 18.])
dform:  4
size:   10
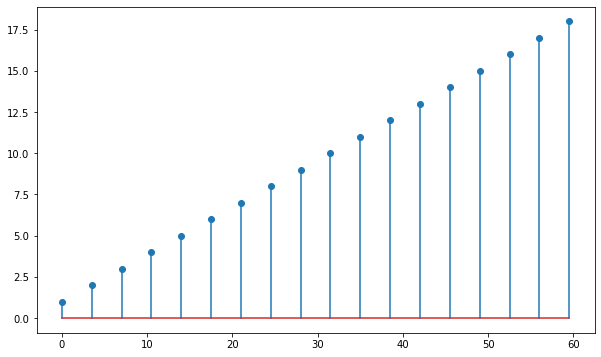
# a simple plot
fig1 = plt.subplots(figsize=(10, 6))
plt.stem(data.epocs.Pu1e.onset, data.epocs.Pu1e.data)
plt.show()