Example Python Notebooks for Offline Analysis
TDT Examples
Introduction to Python
Introduction to Python
Tips for getting started with Python.
Includes side-by-side comparisons to MATLAB and TDT's MATLAB data tools.
Download Notebook
Download as Python file
Try the Interactive Notebook Online
Stream Plot Example
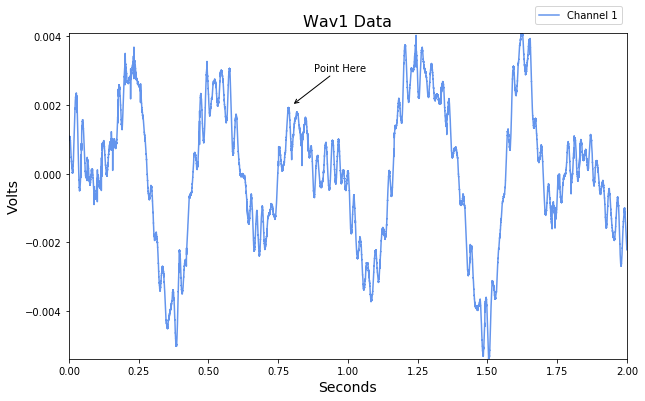
Stream Plot Example
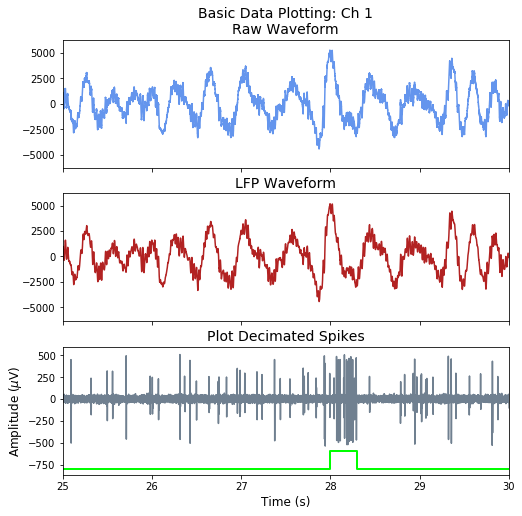
Import continuous data into Python using read_block.
Plot a single channel of data with various filtering schemes.
Good for first-pass visualization of streamed data.
Download Notebook
Download as Python file
Try the Interactive Notebook Online
Averaging Example
Averaging Example
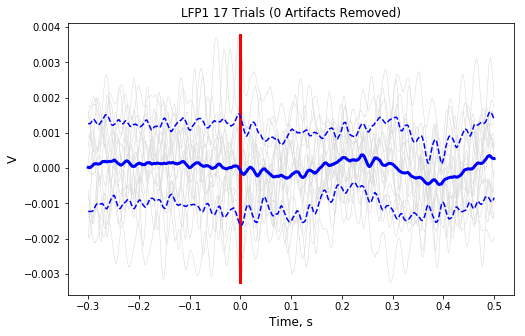
Import stream and epoc data into Python using read_block.
Plot the average waveform around the epoc event.
Good for Evoked Potential detection.
Download Notebook
Download as Python file
Try the Interactive Notebook Online
Raster PSTH Example
Raster PSTH Example
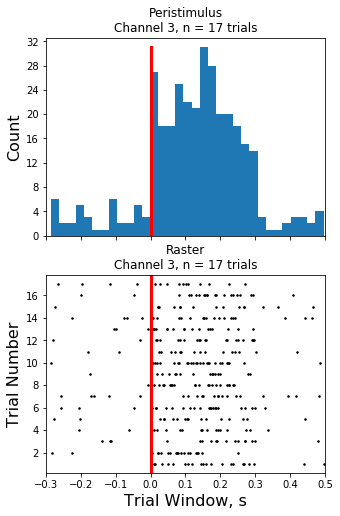
Import snippet and epoc data into Python using read_block.
Generate peristimulus raster and histogram plots over all trials.
Good for stim-response experiments, such as optogenetic or electrical stimulation.
Download Notebook
Download as Python file
Try the Interactive Notebook Online
Note Filter Example
Note Filter Example
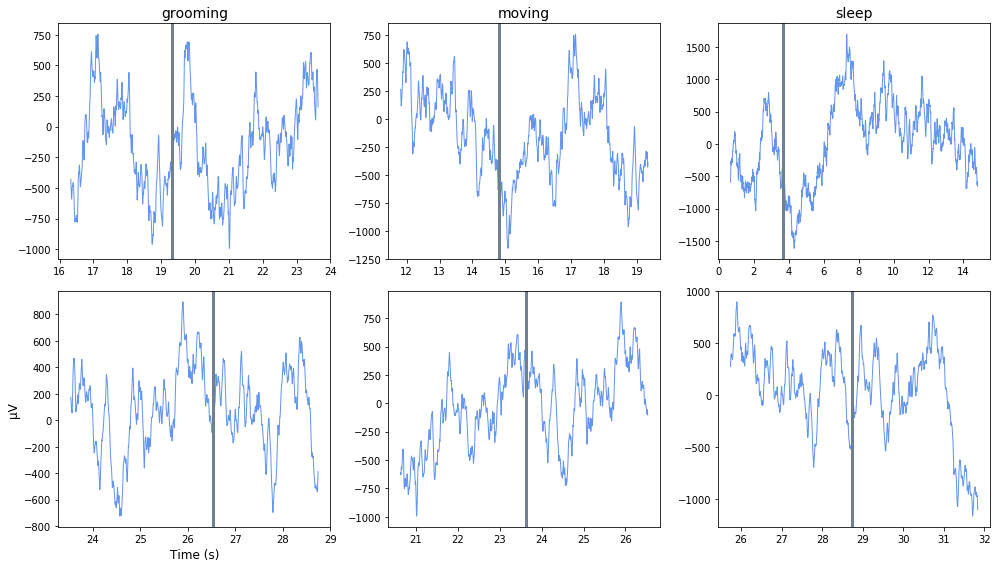
Import streaming EEG data into Python using read_block.
Filter around behavioral events that were timestamped by the user using the Run-time Notes feature in Synapse.
Plot each occurrence in a subplot organized by Note type.
Good for sleep scoring and behavioral discrimination.
Download Notebook
Download as Python file
Try the Interactive Notebook Online
TDT Community Examples
Fiber Photometry Epoch Averaging Example
Fiber Photometry Epoch Averaging Example
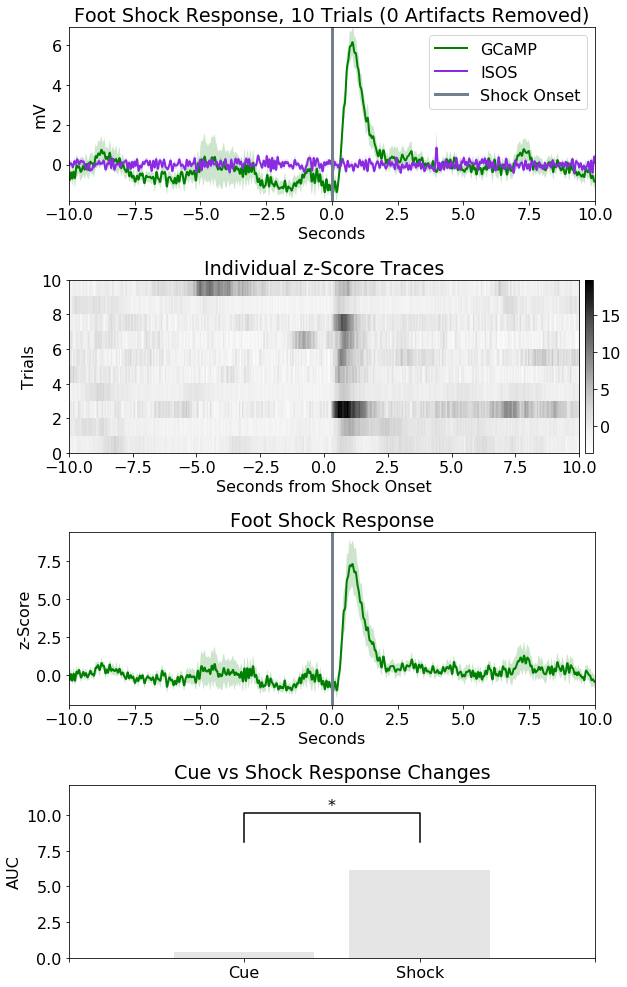
This example goes through fiber photometry analysis using techniques such as data smoothing,
bleach detrending, and z-score analysis. The epoch averaging was done using epoc_filter.
Author Contributions:
TDT, David Root, and the Morales Lab contributed to the writing and/or conceptualization of the code.
The signal processing pipeline was inspired by the workflow developed by
David Barker et al. (2017) for the Morales Lab.
The data used in the example were provided by David Root.
Author Information:
David H. Root
Assistant Professor
Department of Psychology & Neuroscience
University of Colorado, Boulder
Lab Website: https://www.root-lab.org
david.root@colorado.edu
About the authors:
The Root lab and Morales lab investigate the neurobiology of reward, aversion, addiction, and depression.
TDT edits all user submissions in coordination with the contributing author(s) prior to publishing.
Download Notebook
Download as Python file
Try the Interactive Notebook Online
Licking Bout Epoc Filtering
Licking Bout Epoc Filtering
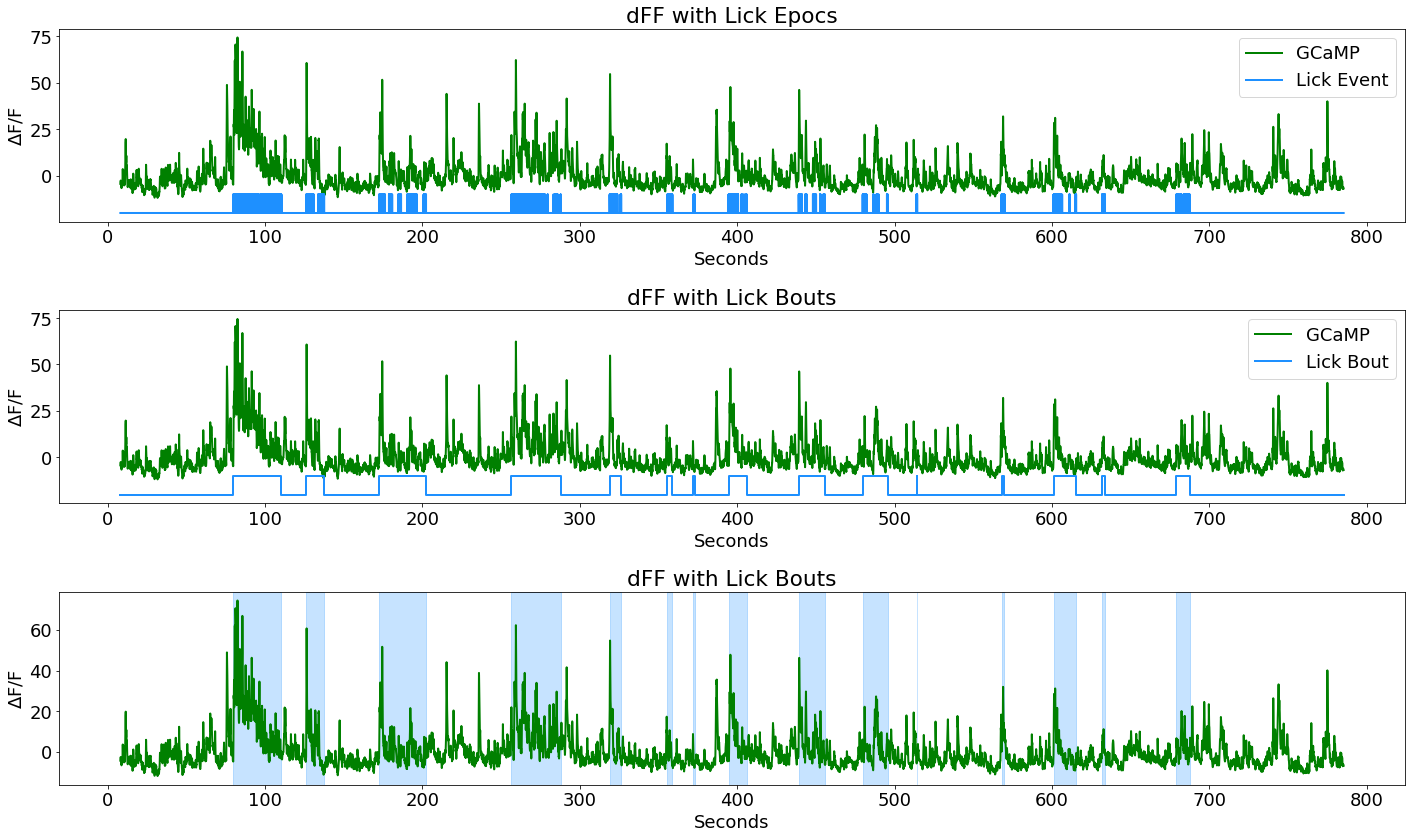
This example looks at fiber photometry data in the VTA where subjects are provided sucrose water after a fasting period.
Lick events are captured as TTL pulses. Objective is to combine many consecutive licking events into a single event based on time difference and lick count thresholds.
New lick bout events can then be used for clear peri-event filtering.
Download Notebook
Download as Python file
Try the Interactive Notebook Online
We think that cultivating a strong and open community of TDT users is essential for maximizing research efficiency. The cross-pollination of ideas and methods across labs, especially those with similar research interests and using the same equipment, makes the science more rigorous overall. As such, we would like YOU to consider contributing to the TDT community with an example analysis and workbook, like the ones at the top of this page.
You can submit your examples to TDT by emailing support@tdt.com. Include your name, lab information, research interests, Python script, and a link to the block of data used in the analysis. Accepted submissions will be featured on this webpage, along with a description of the analysis and a bio of the submitting researcher. We hope that this exposure will help our users learn more about what great research others in the TDT community are doing!
Please note that, as with all our example workbooks, these workbooks represent one way of processing data. Moreover, the goal is really to show users how they might implement certain techniques on their data. These examples should not represent complete pipelines for your data analysis, and critical thought about which processing techniques and statistical analyses are most appropriate for your data set should be taken.