The Software Interface
This chapter introduces the SigCalRP interface, menus, and dialog boxes.
SigCalRP Plots
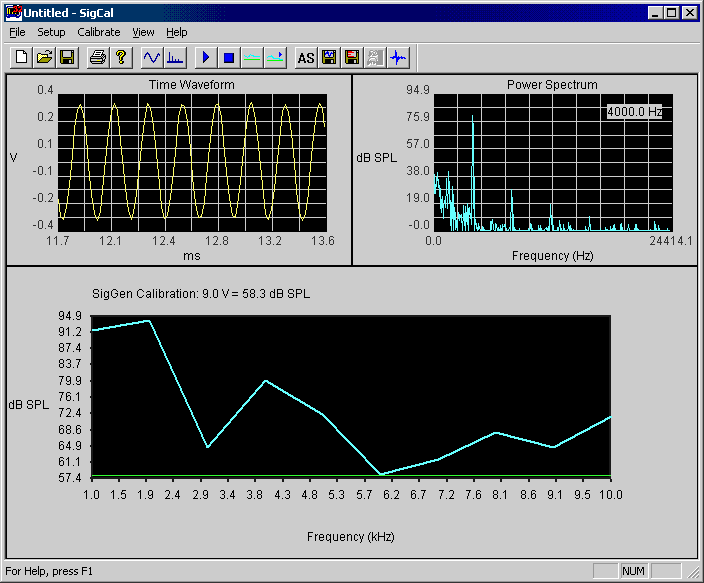
The main SigCalRP workspace, shown below, is divided into three plot areas.
- The Time Waveform shows the time domain plot of the recorded signal.
- The Power Spectrum shows the frequency domain plot of the recorded signal.
- The Calibration plot shows the speaker calibration, normalization curve, normalization curve test data, and total harmonic distortion (THD) measurements.
To inspect different frequencies after the calibration is completed, right-click on the calibration plot. The Time waveform and Power spectrum will be updated for the frequency that is clicked.
Screen Controls
Zooming the Time and Frequency Plots
Zoom in on a plot by clicking the left mouse button and dragging to the right. To zoom out, click the right mouse button while it is in the plot area.
Zooming the Calibration Plot
The dB SPL scale may be manually zoomed out by left-clicking in either the upper or lower part of the scale to change the maximum and minimum plot values.
Right-click in the scale to zoom in on the plot.
Autoscale may also be used to automatically scale the plot.
Moving the Normalization Line
The green normalization line may be moved by pressing and holding the left mouse button while dragging the line to a new position.
Inspecting Individual Frequencies
To inspect the time and frequency plots of different frequencies, right-click the frequency you wish to view in the calibration plot. The current frequency being displayed is shown in the upper right corner of the frequency plot. Only the last 100 frequencies tested are stored in memory.
Menus
File Menu
The File menu includes commands for opening and saving SigCal files. SigCal files have the .cal extension and contain all of the SigCalRP settings as well as the data for SigCal files that have been run. Note that the functions to export normalization files and to export calibration data to an ASCII file are found under the Calibrate menu.
New: Opens a new SigCal file with no calibration data. Previous SigCalRP settings are maintained.
Open/Save/Save As: These commands will open and save all of the settings and calibration data in a SigCal file. The most recent SigCal files are shown at the bottom of the File menu.
Print/Print Setup: These commands are used to print the current SigCalRP screen. The size of the plot on the printer is directly proportional to the size of the SigCalRP window. So, to increase the size of the plot, maximize the SigCalRP window.
Exit: Exits the SigCalRP program.
Calibrate Menu
Start: Once the calibration signal and acquisition have been configured, Start plays the calibration tone series and begins acquisition and analysis. While calibration is in process, the signal values can not be changed. Click Stop before changing any settings.
Stop: Stops calibration procedure. If a calibration series is not complete, there may be invalid data for the rest of a series. When generating normalization files, be sure to run the calibration through the entire frequency series.
Test Norm: Runs through the calibration series and applies the normalization data to the calibration tones. This allows you to test whether the normalization file will work in SigGenRP. The dotted lines produced by the test normalization series should be close to the green normalization line.
Iterate: Runs through the calibration series and applies the normalization data to the calibration tones. The normalization data will then be adjusted to account for any deviations from the normalization line. Iterate may be run several times in a row to try to improve matching to the normalization line.
Autoscale: Autoscale will scale the left hand y axis to the minimum and maximum of the calibration curves.
Save Norm: Saves normalization data to a SigGenRP normalization file (*.nrm).
Export Calibration Data: Saves calibration data to an ASCII text file that may be imported to a spreadsheet. The calibration data includes the SigGenRP calibration value, the calibration without normalization calculated from both the time signal and power spectrum. The total harmonic distortion measurement, and the normalization curve. If a test normalization is run, these data are also saved to the data file.
Export Raw Data: Saves raw data from time signals and power spectra from all of the frequencies tested to two separate files. The time signal data are saved as volts and the power spectra as dB SPL. It takes several seconds to save the data. A maximum of 100 time and frequency buffers may be saved. If more frequencies were tested, only the last 100 will be saved.
Save SigGen File: If a SigGenRP variable is used to generate the tone frequency series, the calibrated value determined by SigCalRP can be saved to that SigGen file or a new SigGen file. For example, if SigCalRP determines that 9.0 V = 105.5 dB. This calibration may be saved to the SigGen file by choosing Save SigGen file. This would modify the calibration values that you see in the SigGenRP Signal dialog box (opened by choosing Signal from the Modify menu in SigGenRP).
Save Variable Schedule File: Saves a variable schedule file that contains two variables: Freq and CalAtten. This schedule file can be used to calibrate a frequency series in SigGenRP through the use of a programmable attenuator. It is not useful for non-tonal signals, like noise. The schedule file will list each frequency tested and the amount of attenuation needed to calibrate that frequency. The schedule file will also contain header information about the calibration values that should be set in SigGenRP (note: these will not be set automatically), and the date and time the schedule file was saved.
View Menu
Time Signal SPL: When checked, plots the SPL measured from the time domain signal in yellow. This SPL measurement will often be higher than the SPL measurement from the power spectrum (shown in blue) due to background noise outside the frequency band measured.
THD: When checked, the THD values are plotted as brown squares on a scale of 0 to 2%. If Normalization Curve is also plotted, the THD scale will not be shown. THD is calculated using the first four harmonics of the test signal.
Normalization Curve: When checked, the normalization data that are applied to the test signal are plotted as a purple line. The y scale for the normalization curve is shown on the right and is automatically scaled.
Toolbar: Shows the toolbar.
Status Bar: Shows the status bar.
Signal Setup Dialog
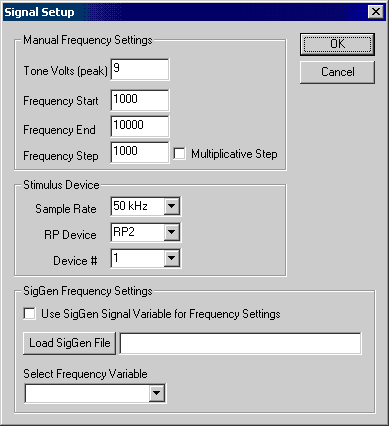
The Signal Setup dialog box is used to setup the calibration tone voltage and frequency series. The frequency series can be set through the Manual Frequency Settings or by using a frequency variable from a SigGen file.
Manual Frequency Settings
These settings are used to produce a series of tones whose SPL will be measured.
Tone Volts (peak): The peak voltage (i.e. not rms voltage) of the calibration tones. The D/A have a maximum peak voltage of 10 V. This value is used for generating the test signals for either the Manual Frequency Settings or SigGen Frequency Settings.
Frequency Start: The first frequency of the calibration tone series.
Frequency End: The last frequency of the calibration tone series.
Frequency Step: The step value used to generate the tone series. The tone series may consist of a maximum of 1000 frequencies.
Multiplicative Step Check Box: Not checked... the step value is a linear step. Note: the Frequency End value is inclusive. For example, if Frequency Start is 1000, Frequency End is 10000, and Frequency Step is 1000, the frequency series will be: 1000, 2000, 3000, ..., 10000.
Checked... the step value will be used as a multiplier. Note: the Frequency End value is non-inclusive. For example, if Frequency Start is 100, Frequency End is 6401, and Frequency Step is 2, the frequency series will be: 100, 200, 400, 800, 1600, 3200, 6400.
Stimulus Device Setup
These setting are used to configure the RPx device that will be used to generate the signals. It will load the appropriate RPvds file to the device for stimulus generation. The same or different RPx device may be used for acquisition.
Sample Rate: The sample rate for the D/A and A/D converters (they both must be the same for calibration). The maximum frequency that may be used for the frequency series is one-half of the sample rate.
RP Device: Selects the RP Device type.
Device #: Selects the device by logical index number. Device numbers can be viewed using the zBusMon utility.
SigGen Frequency Settings
A frequency series may also be specified by loading a SigGenRP signal and choosing a variable that contains the values of the frequencies you want tested. It is important to note that the SigGenRP signal will not be used in the calculation. Instead, a series of tones will be generated with each tone's frequency specified by the selected SigGenRP variable. The amplitude of the tone is set in the Tone Volts edit box in the Manual Frequency Settings section. When a SigGen file is used the manual settings that can not be adjusted are grayed out. The sample rate is set to the sample rate specified in the SigGen file. The start and stop frequencies are determined from the SigGenRP variable and listed in the manual settings section.
Use SigGen Signal Variable for Frequency Settings Check Box: Enables or disables the use of SigGen Frequency Settings.
Not checked... The settings in the Manual Frequency settings area are used.
Checked... Frequency settings will be loaded from the specified file and variable.
Load SigGen File: Specifies the SigGen File to be used to select a variable.
Select Frequency Variable: Specifies the variable to be used for the frequency settings.
Acquisition Setup Dialog
The Setup Acquisition dialog box is used to configure the A/D converter, configure options for averaging, and to set the microphone calibration and gain.
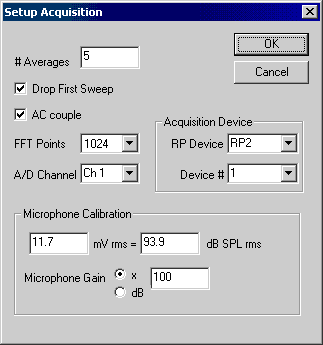
# Averages: Enter the value for the number of sweeps that will be acquired and averaged to obtain the calibration measurement. More sweeps will reduce the influence of background noise that is not produced by the transducer.
Drop First Sweep: Check this box to drop the first sweep and not include it in the overall average. Since the D/A and A/D start converting simultaneously, the time it takes the signal to reach the microphone will be recorded as no signal, if the first sweep is included. By dropping the first sweep, the effect of this travel time on the calibration value is minimized.
AC couple: Check this box to remove any DC shift from your signal. This is done mathematically after the signal is acquired.
FFT Points: This is the number of points used by the inverse FFT to generate the signal and the number of points used by the FFT to calculate the power spectrum. A larger number of FFT points will produce a longer test signal with greater frequency resolution.
A/D Channel: Selects which A/D channel is used to acquire the signal.
Acquisition Device: This section is used to select which device is used for acquisition. The same device may be used for both acquisition and stimulation, except when the sample rate is 200 kHz.
Microphone Calibration: Enter the value for the microphone calibration here as the number of millivolts produced by the microphone for a given SPL. This value is typically provided by the microphone manufacturer.
Microphone Gain: Enter the amount of gain on the microphone before the signal is sent to the A/D converter. Do not enter any gain that is already accounted for by the microphone calibration you entered.
The gain value may be specified as either linear by checking 'x' or as logarithmic by checking 'dB'. For example a value of 100 with 'x' checked corresponds to 100x gain. A value of 100 with dB checked corresponds to 100 dB gain.
SigCalRP assumes that the microphone response is flat.
SigCalRP uses this value to calculate the voltage output of the microphone and then uses the microphone calibration data provided above to determine the dB SPL at the microphone tip.